Leptospira phage LE1
Taxonomy: Viruses; Duplodnaviria; Heunggongvirae; Uroviricota; Caudoviricetes; Caudovirales; Myoviridae; Saintgironsvirus; Leptospira virus LE1
Average proteome isoelectric point is 6.75
Get precalculated fractions of proteins

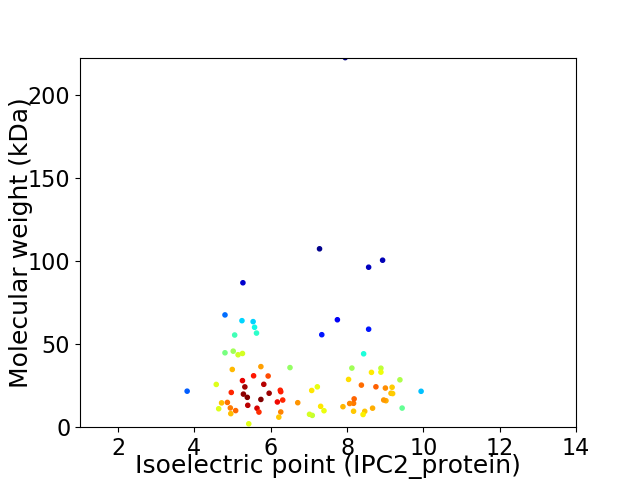
Virtual 2D-PAGE plot for 81 proteins (isoelectric point calculated using IPC2_protein)
Get csv file with sequences according to given criteria:
* You can choose from 21 different methods for calculating isoelectric point
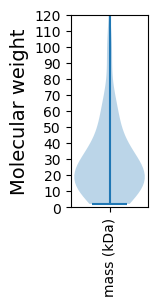
Summary statistics related to proteome-wise predictions


Protein with the lowest isoelectric point:
>tr|Q6NE33|Q6NE33_9CAUD Uncharacterized protein OS=Leptospira phage LE1 OX=137511 GN=LE1-0010 PE=4 SV=1
MM1 pKa = 7.43EE2 pKa = 5.49NKK4 pKa = 10.21NEE6 pKa = 4.24TKK8 pKa = 10.25EE9 pKa = 3.91QVAVEE14 pKa = 4.12EE15 pKa = 4.38TPEE18 pKa = 4.14TFTEE22 pKa = 4.43EE23 pKa = 3.92VMEE26 pKa = 4.92DD27 pKa = 3.6SEE29 pKa = 4.88SVQTAVVEE37 pKa = 4.57GVDD40 pKa = 3.76TVSGDD45 pKa = 3.54GTGEE49 pKa = 3.92PLPEE53 pKa = 4.42FDD55 pKa = 5.35QEE57 pKa = 4.31NPSDD61 pKa = 4.02LKK63 pKa = 11.17DD64 pKa = 3.74GNVLNPPPEE73 pKa = 4.26IEE75 pKa = 4.13EE76 pKa = 4.25EE77 pKa = 4.18NLGEE81 pKa = 3.97EE82 pKa = 5.04ASAEE86 pKa = 3.88DD87 pKa = 4.15LGIGFIQGEE96 pKa = 4.18IDD98 pKa = 3.42HH99 pKa = 6.99LSEE102 pKa = 4.65QEE104 pKa = 4.08KK105 pKa = 9.9TEE107 pKa = 4.08LGYY110 pKa = 9.44TISDD114 pKa = 3.37ILATPNQSQSIIVSMVINAILDD136 pKa = 3.61KK137 pKa = 11.08VGSVNPNAIEE147 pKa = 4.23ALGQLSTQIVEE158 pKa = 4.21RR159 pKa = 11.84AATQEE164 pKa = 3.83YY165 pKa = 7.88LTLVSEE171 pKa = 4.63FEE173 pKa = 4.55GVVSSGLPNATKK185 pKa = 10.67LSLYY189 pKa = 10.06SQQLDD194 pKa = 3.42QFAKK198 pKa = 10.7RR199 pKa = 11.84LGG201 pKa = 3.53
MM1 pKa = 7.43EE2 pKa = 5.49NKK4 pKa = 10.21NEE6 pKa = 4.24TKK8 pKa = 10.25EE9 pKa = 3.91QVAVEE14 pKa = 4.12EE15 pKa = 4.38TPEE18 pKa = 4.14TFTEE22 pKa = 4.43EE23 pKa = 3.92VMEE26 pKa = 4.92DD27 pKa = 3.6SEE29 pKa = 4.88SVQTAVVEE37 pKa = 4.57GVDD40 pKa = 3.76TVSGDD45 pKa = 3.54GTGEE49 pKa = 3.92PLPEE53 pKa = 4.42FDD55 pKa = 5.35QEE57 pKa = 4.31NPSDD61 pKa = 4.02LKK63 pKa = 11.17DD64 pKa = 3.74GNVLNPPPEE73 pKa = 4.26IEE75 pKa = 4.13EE76 pKa = 4.25EE77 pKa = 4.18NLGEE81 pKa = 3.97EE82 pKa = 5.04ASAEE86 pKa = 3.88DD87 pKa = 4.15LGIGFIQGEE96 pKa = 4.18IDD98 pKa = 3.42HH99 pKa = 6.99LSEE102 pKa = 4.65QEE104 pKa = 4.08KK105 pKa = 9.9TEE107 pKa = 4.08LGYY110 pKa = 9.44TISDD114 pKa = 3.37ILATPNQSQSIIVSMVINAILDD136 pKa = 3.61KK137 pKa = 11.08VGSVNPNAIEE147 pKa = 4.23ALGQLSTQIVEE158 pKa = 4.21RR159 pKa = 11.84AATQEE164 pKa = 3.83YY165 pKa = 7.88LTLVSEE171 pKa = 4.63FEE173 pKa = 4.55GVVSSGLPNATKK185 pKa = 10.67LSLYY189 pKa = 10.06SQQLDD194 pKa = 3.42QFAKK198 pKa = 10.7RR199 pKa = 11.84LGG201 pKa = 3.53
Molecular weight: 21.7 kDa
Isoelectric point according different methods:
Protein with the highest isoelectric point:
>tr|Q6NE27|Q6NE27_9CAUD Uncharacterized protein OS=Leptospira phage LE1 OX=137511 GN=LE1-0016 PE=4 SV=1
MM1 pKa = 7.08FQGTTFGTRR10 pKa = 11.84LAEE13 pKa = 3.86IFKK16 pKa = 9.33TRR18 pKa = 11.84TRR20 pKa = 11.84IVSNKK25 pKa = 8.61FQQKK29 pKa = 9.11RR30 pKa = 11.84AKK32 pKa = 9.78QVIGKK37 pKa = 8.88EE38 pKa = 4.0RR39 pKa = 11.84VEE41 pKa = 4.35LLTFTHH47 pKa = 7.14RR48 pKa = 11.84FYY50 pKa = 11.28LHH52 pKa = 6.12YY53 pKa = 9.78MNPIHH58 pKa = 6.81RR59 pKa = 11.84WIVLALFKK67 pKa = 11.06LSVKK71 pKa = 10.67ANLRR75 pKa = 11.84KK76 pKa = 9.78KK77 pKa = 10.02PRR79 pKa = 11.84LSEE82 pKa = 3.81FLQFLSQFIQAFAGYY97 pKa = 9.86SVTHH101 pKa = 6.1VSNVPPKK108 pKa = 10.04IDD110 pKa = 3.41IYY112 pKa = 11.7SMGIRR117 pKa = 11.84IGLANFFWKK126 pKa = 10.26RR127 pKa = 11.84RR128 pKa = 11.84WLLMCKK134 pKa = 9.89IFLLGKK140 pKa = 10.28DD141 pKa = 3.56PDD143 pKa = 5.37FIDD146 pKa = 3.23SMKK149 pKa = 10.73RR150 pKa = 11.84LIVSNYY156 pKa = 9.93RR157 pKa = 11.84EE158 pKa = 4.27GLNLPEE164 pKa = 4.01PTANEE169 pKa = 4.1VNRR172 pKa = 11.84GSARR176 pKa = 11.84QVLPLKK182 pKa = 10.48QVV184 pKa = 2.88
MM1 pKa = 7.08FQGTTFGTRR10 pKa = 11.84LAEE13 pKa = 3.86IFKK16 pKa = 9.33TRR18 pKa = 11.84TRR20 pKa = 11.84IVSNKK25 pKa = 8.61FQQKK29 pKa = 9.11RR30 pKa = 11.84AKK32 pKa = 9.78QVIGKK37 pKa = 8.88EE38 pKa = 4.0RR39 pKa = 11.84VEE41 pKa = 4.35LLTFTHH47 pKa = 7.14RR48 pKa = 11.84FYY50 pKa = 11.28LHH52 pKa = 6.12YY53 pKa = 9.78MNPIHH58 pKa = 6.81RR59 pKa = 11.84WIVLALFKK67 pKa = 11.06LSVKK71 pKa = 10.67ANLRR75 pKa = 11.84KK76 pKa = 9.78KK77 pKa = 10.02PRR79 pKa = 11.84LSEE82 pKa = 3.81FLQFLSQFIQAFAGYY97 pKa = 9.86SVTHH101 pKa = 6.1VSNVPPKK108 pKa = 10.04IDD110 pKa = 3.41IYY112 pKa = 11.7SMGIRR117 pKa = 11.84IGLANFFWKK126 pKa = 10.26RR127 pKa = 11.84RR128 pKa = 11.84WLLMCKK134 pKa = 9.89IFLLGKK140 pKa = 10.28DD141 pKa = 3.56PDD143 pKa = 5.37FIDD146 pKa = 3.23SMKK149 pKa = 10.73RR150 pKa = 11.84LIVSNYY156 pKa = 9.93RR157 pKa = 11.84EE158 pKa = 4.27GLNLPEE164 pKa = 4.01PTANEE169 pKa = 4.1VNRR172 pKa = 11.84GSARR176 pKa = 11.84QVLPLKK182 pKa = 10.48QVV184 pKa = 2.88
Molecular weight: 21.62 kDa
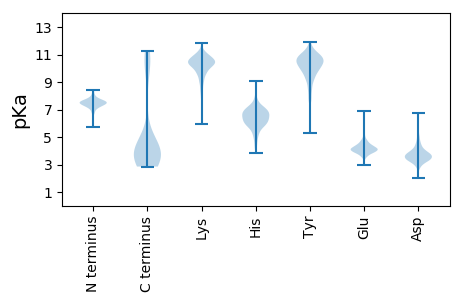
Isoelectric point according different methods:
Peptides (in silico digests for buttom-up proteomics)
Below you can find in silico digests of the whole proteome with Trypsin, Chymotrypsin, Trypsin+LysC, LysN, ArgC proteases suitable for different mass spec machines.| Try ESI |
 |
|---|
| ChTry ESI |
 |
|---|
| ArgC ESI |
 |
|---|
| LysN ESI |
 |
|---|
| TryLysC ESI |
 |
|---|
| Try MALDI |
 |
|---|
| ChTry MALDI |
 |
|---|
| ArgC MALDI |
 |
|---|
| LysN MALDI |
 |
|---|
| TryLysC MALDI |
 |
|---|
| Try LTQ |
 |
|---|
| ChTry LTQ |
 |
|---|
| ArgC LTQ |
 |
|---|
| LysN LTQ |
 |
|---|
| TryLysC LTQ |
 |
|---|
| Try MSlow |
 |
|---|
| ChTry MSlow |
 |
|---|
| ArgC MSlow |
 |
|---|
| LysN MSlow |
 |
|---|
| TryLysC MSlow |
 |
|---|
| Try MShigh |
 |
|---|
| ChTry MShigh |
 |
|---|
| ArgC MShigh |
 |
|---|
| LysN MShigh |
 |
|---|
| TryLysC MShigh |
 |
|---|
General Statistics
Number of major isoforms |
Number of additional isoforms |
Number of all proteins |
Number of amino acids |
Min. Seq. Length |
Max. Seq. Length |
Avg. Seq. Length |
Avg. Mol. Weight |
|---|---|---|---|---|---|---|---|
0 |
22680 |
18 |
1971 |
280.0 |
31.66 |
Amino acid frequency
Ala |
Cys |
Asp |
Glu |
Phe |
Gly |
His |
Ile |
Lys |
Leu |
|---|---|---|---|---|---|---|---|---|---|
6.098 ± 0.223 | 0.763 ± 0.102 |
5.692 ± 0.15 | 7.694 ± 0.262 |
4.815 ± 0.185 | 6.658 ± 0.339 |
1.42 ± 0.106 | 7.381 ± 0.23 |
8.884 ± 0.476 | 8.633 ± 0.267 |
Met |
Asn |
Gln |
Pro |
Arg |
Ser |
Thr |
Val |
Trp |
Tyr |
|---|---|---|---|---|---|---|---|---|---|
1.914 ± 0.106 | 5.203 ± 0.165 |
4.043 ± 0.138 | 3.677 ± 0.153 |
4.709 ± 0.199 | 7.429 ± 0.236 |
5.088 ± 0.207 | 5.384 ± 0.209 |
1.235 ± 0.095 | 3.28 ± 0.126 |
Most of the basic statistics you can see at this page can be downloaded from this CSV file
Proteome-pI is available under Creative Commons Attribution-NoDerivs license, for more details see here
| Reference: Kozlowski LP. Proteome-pI 2.0: Proteome Isoelectric Point Database Update. Nucleic Acids Res. 2021, doi: 10.1093/nar/gkab944 | Contact: Lukasz P. Kozlowski |
