Monosporascus sp. CRB-8-3
Taxonomy: cellular organisms; Eukaryota; Opisthokonta; Fungi; Dikarya; Ascomycota; saccharomyceta; Pezizomycotina; leotiomyceta; sordariomyceta; Sordariomycetes; Xylariomycetidae; Xylariales; Xylariales incertae sedis; Monosporascus; unclassified Monosporascus
Average proteome isoelectric point is 6.4
Get precalculated fractions of proteins

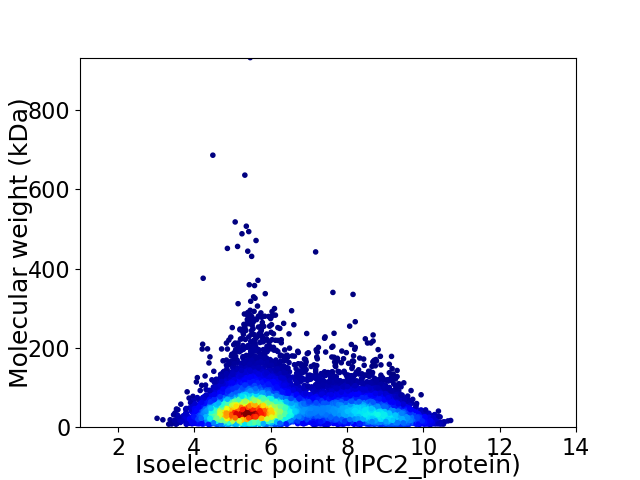
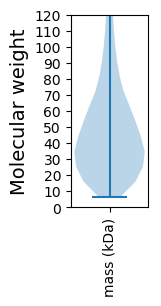
Virtual 2D-PAGE plot for 11773 proteins (isoelectric point calculated using IPC2_protein)
Get csv file with sequences according to given criteria:
* You can choose from 21 different methods for calculating isoelectric point
Summary statistics related to proteome-wise predictions


Protein with the lowest isoelectric point:
>tr|A0A4Q4Z236|A0A4Q4Z236_9PEZI J domain-containing protein OS=Monosporascus sp. CRB-8-3 OX=2211644 GN=DL769_002219 PE=4 SV=1
MM1 pKa = 7.59YY2 pKa = 7.97YY3 pKa = 7.79TTASFLALLGLASCQKK19 pKa = 9.52LHH21 pKa = 5.79VVSVSGEE28 pKa = 4.3GEE30 pKa = 3.81WALKK34 pKa = 9.78FMPDD38 pKa = 3.65NIKK41 pKa = 10.55AAAGDD46 pKa = 3.78MIQFQFRR53 pKa = 11.84AGNHH57 pKa = 5.33SVVQSNFDD65 pKa = 3.78NPCEE69 pKa = 4.28PIKK72 pKa = 10.41MHH74 pKa = 6.86TDD76 pKa = 3.06TEE78 pKa = 4.68GFYY81 pKa = 10.77SGYY84 pKa = 10.18QPVAASEE91 pKa = 4.18EE92 pKa = 4.15MDD94 pKa = 4.22MIPTYY99 pKa = 10.72TIMVQDD105 pKa = 5.08DD106 pKa = 3.86KK107 pKa = 11.51PMWMYY112 pKa = 10.81CSQGQHH118 pKa = 5.97CQNGMTMVVNEE129 pKa = 3.92NTAANSSRR137 pKa = 11.84SLDD140 pKa = 3.65EE141 pKa = 3.78YY142 pKa = 11.2RR143 pKa = 11.84KK144 pKa = 9.88LAAEE148 pKa = 4.6APDD151 pKa = 3.92NLAGDD156 pKa = 3.82VPGAGGEE163 pKa = 4.32TGTTPEE169 pKa = 4.15PTEE172 pKa = 4.55PGDD175 pKa = 5.29DD176 pKa = 3.55EE177 pKa = 4.42TTAPGDD183 pKa = 3.81EE184 pKa = 4.5EE185 pKa = 4.76TPATPGGDD193 pKa = 3.4DD194 pKa = 3.58TTDD197 pKa = 3.92DD198 pKa = 4.37GASDD202 pKa = 4.97DD203 pKa = 5.46APTDD207 pKa = 3.7DD208 pKa = 4.7DD209 pKa = 4.45TTVGTPGEE217 pKa = 4.58DD218 pKa = 3.31TTSTPGSDD226 pKa = 3.17ATPTGTAGGVASGTEE241 pKa = 3.98AADD244 pKa = 3.89GASTSIAQVAGGSMVTVTSPMGFFALAAAFFVLL277 pKa = 4.98
MM1 pKa = 7.59YY2 pKa = 7.97YY3 pKa = 7.79TTASFLALLGLASCQKK19 pKa = 9.52LHH21 pKa = 5.79VVSVSGEE28 pKa = 4.3GEE30 pKa = 3.81WALKK34 pKa = 9.78FMPDD38 pKa = 3.65NIKK41 pKa = 10.55AAAGDD46 pKa = 3.78MIQFQFRR53 pKa = 11.84AGNHH57 pKa = 5.33SVVQSNFDD65 pKa = 3.78NPCEE69 pKa = 4.28PIKK72 pKa = 10.41MHH74 pKa = 6.86TDD76 pKa = 3.06TEE78 pKa = 4.68GFYY81 pKa = 10.77SGYY84 pKa = 10.18QPVAASEE91 pKa = 4.18EE92 pKa = 4.15MDD94 pKa = 4.22MIPTYY99 pKa = 10.72TIMVQDD105 pKa = 5.08DD106 pKa = 3.86KK107 pKa = 11.51PMWMYY112 pKa = 10.81CSQGQHH118 pKa = 5.97CQNGMTMVVNEE129 pKa = 3.92NTAANSSRR137 pKa = 11.84SLDD140 pKa = 3.65EE141 pKa = 3.78YY142 pKa = 11.2RR143 pKa = 11.84KK144 pKa = 9.88LAAEE148 pKa = 4.6APDD151 pKa = 3.92NLAGDD156 pKa = 3.82VPGAGGEE163 pKa = 4.32TGTTPEE169 pKa = 4.15PTEE172 pKa = 4.55PGDD175 pKa = 5.29DD176 pKa = 3.55EE177 pKa = 4.42TTAPGDD183 pKa = 3.81EE184 pKa = 4.5EE185 pKa = 4.76TPATPGGDD193 pKa = 3.4DD194 pKa = 3.58TTDD197 pKa = 3.92DD198 pKa = 4.37GASDD202 pKa = 4.97DD203 pKa = 5.46APTDD207 pKa = 3.7DD208 pKa = 4.7DD209 pKa = 4.45TTVGTPGEE217 pKa = 4.58DD218 pKa = 3.31TTSTPGSDD226 pKa = 3.17ATPTGTAGGVASGTEE241 pKa = 3.98AADD244 pKa = 3.89GASTSIAQVAGGSMVTVTSPMGFFALAAAFFVLL277 pKa = 4.98
Molecular weight: 28.68 kDa
Isoelectric point according different methods:
Protein with the highest isoelectric point:
>tr|A0A4Q4YZM1|A0A4Q4YZM1_9PEZI FAA_hydrolase domain-containing protein OS=Monosporascus sp. CRB-8-3 OX=2211644 GN=DL769_002359 PE=3 SV=1
MM1 pKa = 7.42RR2 pKa = 11.84QYY4 pKa = 11.51HH5 pKa = 7.55DD6 pKa = 3.13ITEE9 pKa = 4.5LEE11 pKa = 3.9RR12 pKa = 11.84SRR14 pKa = 11.84RR15 pKa = 11.84RR16 pKa = 11.84MEE18 pKa = 3.8EE19 pKa = 3.4RR20 pKa = 11.84RR21 pKa = 11.84GLYY24 pKa = 9.47QRR26 pKa = 11.84AASFKK31 pKa = 9.01AHH33 pKa = 6.46AEE35 pKa = 3.96AMEE38 pKa = 4.31VAQQRR43 pKa = 11.84AKK45 pKa = 10.18IVRR48 pKa = 11.84PLEE51 pKa = 4.2SLPNPAVPAPAEE63 pKa = 3.94AAAGLGRR70 pKa = 11.84LAFLPNEE77 pKa = 4.16VVMMVLQHH85 pKa = 5.38CTVRR89 pKa = 11.84TLFRR93 pKa = 11.84LQRR96 pKa = 11.84VNRR99 pKa = 11.84ATGMMVRR106 pKa = 11.84LLPNFSYY113 pKa = 9.44VTNTAKK119 pKa = 10.66GMLEE123 pKa = 3.71RR124 pKa = 11.84AIMKK128 pKa = 10.25RR129 pKa = 11.84LTATLTFTGLRR140 pKa = 11.84HH141 pKa = 6.38LLMSSTCEE149 pKa = 3.71NCGKK153 pKa = 10.29GGCSFQITKK162 pKa = 10.64LGVLCYY168 pKa = 9.86EE169 pKa = 4.49CRR171 pKa = 11.84APPRR175 pKa = 11.84TWIRR179 pKa = 11.84GAKK182 pKa = 9.39GKK184 pKa = 10.8AKK186 pKa = 10.42VPPNN190 pKa = 3.44
MM1 pKa = 7.42RR2 pKa = 11.84QYY4 pKa = 11.51HH5 pKa = 7.55DD6 pKa = 3.13ITEE9 pKa = 4.5LEE11 pKa = 3.9RR12 pKa = 11.84SRR14 pKa = 11.84RR15 pKa = 11.84RR16 pKa = 11.84MEE18 pKa = 3.8EE19 pKa = 3.4RR20 pKa = 11.84RR21 pKa = 11.84GLYY24 pKa = 9.47QRR26 pKa = 11.84AASFKK31 pKa = 9.01AHH33 pKa = 6.46AEE35 pKa = 3.96AMEE38 pKa = 4.31VAQQRR43 pKa = 11.84AKK45 pKa = 10.18IVRR48 pKa = 11.84PLEE51 pKa = 4.2SLPNPAVPAPAEE63 pKa = 3.94AAAGLGRR70 pKa = 11.84LAFLPNEE77 pKa = 4.16VVMMVLQHH85 pKa = 5.38CTVRR89 pKa = 11.84TLFRR93 pKa = 11.84LQRR96 pKa = 11.84VNRR99 pKa = 11.84ATGMMVRR106 pKa = 11.84LLPNFSYY113 pKa = 9.44VTNTAKK119 pKa = 10.66GMLEE123 pKa = 3.71RR124 pKa = 11.84AIMKK128 pKa = 10.25RR129 pKa = 11.84LTATLTFTGLRR140 pKa = 11.84HH141 pKa = 6.38LLMSSTCEE149 pKa = 3.71NCGKK153 pKa = 10.29GGCSFQITKK162 pKa = 10.64LGVLCYY168 pKa = 9.86EE169 pKa = 4.49CRR171 pKa = 11.84APPRR175 pKa = 11.84TWIRR179 pKa = 11.84GAKK182 pKa = 9.39GKK184 pKa = 10.8AKK186 pKa = 10.42VPPNN190 pKa = 3.44
Molecular weight: 21.36 kDa
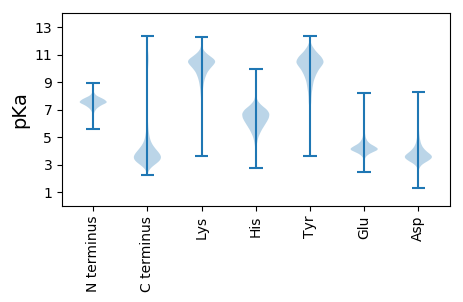
Isoelectric point according different methods:
Peptides (in silico digests for buttom-up proteomics)
Below you can find in silico digests of the whole proteome with Trypsin, Chymotrypsin, Trypsin+LysC, LysN, ArgC proteases suitable for different mass spec machines.| Try ESI |
 |
|---|
| ChTry ESI |
 |
|---|
| ArgC ESI |
 |
|---|
| LysN ESI |
 |
|---|
| TryLysC ESI |
 |
|---|
| Try MALDI |
 |
|---|
| ChTry MALDI |
 |
|---|
| ArgC MALDI |
 |
|---|
| LysN MALDI |
 |
|---|
| TryLysC MALDI |
 |
|---|
| Try LTQ |
 |
|---|
| ChTry LTQ |
 |
|---|
| ArgC LTQ |
 |
|---|
| LysN LTQ |
 |
|---|
| TryLysC LTQ |
 |
|---|
| Try MSlow |
 |
|---|
| ChTry MSlow |
 |
|---|
| ArgC MSlow |
 |
|---|
| LysN MSlow |
 |
|---|
| TryLysC MSlow |
 |
|---|
| Try MShigh |
 |
|---|
| ChTry MShigh |
 |
|---|
| ArgC MShigh |
 |
|---|
| LysN MShigh |
 |
|---|
| TryLysC MShigh |
 |
|---|
General Statistics
Number of major isoforms |
Number of additional isoforms |
Number of all proteins |
Number of amino acids |
Min. Seq. Length |
Max. Seq. Length |
Avg. Seq. Length |
Avg. Mol. Weight |
|---|---|---|---|---|---|---|---|
0 |
5704079 |
66 |
8401 |
484.5 |
53.45 |
Amino acid frequency
Ala |
Cys |
Asp |
Glu |
Phe |
Gly |
His |
Ile |
Lys |
Leu |
|---|---|---|---|---|---|---|---|---|---|
9.184 ± 0.02 | 1.173 ± 0.008 |
5.91 ± 0.017 | 6.347 ± 0.024 |
3.552 ± 0.014 | 7.352 ± 0.021 |
2.333 ± 0.009 | 4.535 ± 0.017 |
4.584 ± 0.02 | 8.74 ± 0.028 |
Met |
Asn |
Gln |
Pro |
Arg |
Ser |
Thr |
Val |
Trp |
Tyr |
|---|---|---|---|---|---|---|---|---|---|
2.106 ± 0.008 | 3.526 ± 0.012 |
6.217 ± 0.026 | 3.841 ± 0.015 |
6.579 ± 0.022 | 7.821 ± 0.026 |
5.778 ± 0.018 | 6.22 ± 0.016 |
1.47 ± 0.008 | 2.731 ± 0.011 |
Most of the basic statistics you can see at this page can be downloaded from this CSV file
Proteome-pI is available under Creative Commons Attribution-NoDerivs license, for more details see here
| Reference: Kozlowski LP. Proteome-pI 2.0: Proteome Isoelectric Point Database Update. Nucleic Acids Res. 2021, doi: 10.1093/nar/gkab944 | Contact: Lukasz P. Kozlowski |
