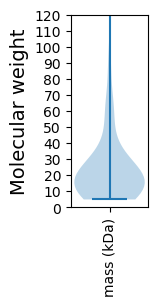
Gordonia phage NHagos
Taxonomy: Viruses; Duplodnaviria; Heunggongvirae; Uroviricota; Caudoviricetes; Caudovirales; Siphoviridae; Sourvirus; unclassified Sourvirus
Average proteome isoelectric point is 5.56
Get precalculated fractions of proteins

Virtual 2D-PAGE plot for 82 proteins (isoelectric point calculated using IPC2_protein)
Get csv file with sequences according to given criteria:
* You can choose from 21 different methods for calculating isoelectric point
Summary statistics related to proteome-wise predictions


Protein with the lowest isoelectric point:
>tr|A0A5Q2WNH9|A0A5Q2WNH9_9CAUD Membrane protein OS=Gordonia phage NHagos OX=2653746 GN=81 PE=4 SV=1
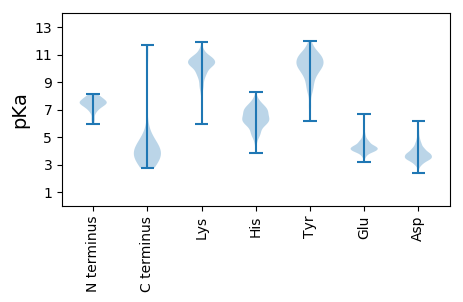
MM1 pKa = 7.53PTTEE5 pKa = 4.1PTFTPTTKK13 pKa = 10.13RR14 pKa = 11.84GRR16 pKa = 11.84ALLLHH21 pKa = 5.75VLEE24 pKa = 5.66IIEE27 pKa = 4.31AEE29 pKa = 4.01ARR31 pKa = 11.84ADD33 pKa = 3.83GYY35 pKa = 11.84GDD37 pKa = 3.54IEE39 pKa = 5.06DD40 pKa = 3.97ISRR43 pKa = 11.84AGHH46 pKa = 6.15WNQGTWGEE54 pKa = 4.19VRR56 pKa = 11.84AEE58 pKa = 3.87DD59 pKa = 5.84LIAQGLDD66 pKa = 3.16FDD68 pKa = 5.14ALLTEE73 pKa = 5.05SGAEE77 pKa = 3.9PGRR80 pKa = 11.84AVDD83 pKa = 3.93LALPVSPVNLCGTACCFAGHH103 pKa = 5.57TTFQVGDD110 pKa = 3.85TPVVNVVANRR120 pKa = 11.84DD121 pKa = 3.71WINTTEE127 pKa = 4.07VLAIMDD133 pKa = 4.33VRR135 pKa = 11.84PVDD138 pKa = 3.62HH139 pKa = 7.66PGLMVPVSTRR149 pKa = 11.84AMEE152 pKa = 4.2LLGLEE157 pKa = 4.13SDD159 pKa = 3.88EE160 pKa = 5.49ADD162 pKa = 4.42LLFEE166 pKa = 5.91ADD168 pKa = 3.45NTLADD173 pKa = 3.54LRR175 pKa = 11.84VIIEE179 pKa = 4.08YY180 pKa = 8.6LTNGVGIVEE189 pKa = 4.56CDD191 pKa = 3.17ACGEE195 pKa = 4.31RR196 pKa = 11.84PWNCPYY202 pKa = 10.7RR203 pKa = 11.84GDD205 pKa = 4.17EE206 pKa = 4.2VCSVCDD212 pKa = 3.78EE213 pKa = 4.74HH214 pKa = 7.89PDD216 pKa = 3.33TCVCYY221 pKa = 10.82SEE223 pKa = 6.13DD224 pKa = 3.61EE225 pKa = 4.2
MM1 pKa = 7.53PTTEE5 pKa = 4.1PTFTPTTKK13 pKa = 10.13RR14 pKa = 11.84GRR16 pKa = 11.84ALLLHH21 pKa = 5.75VLEE24 pKa = 5.66IIEE27 pKa = 4.31AEE29 pKa = 4.01ARR31 pKa = 11.84ADD33 pKa = 3.83GYY35 pKa = 11.84GDD37 pKa = 3.54IEE39 pKa = 5.06DD40 pKa = 3.97ISRR43 pKa = 11.84AGHH46 pKa = 6.15WNQGTWGEE54 pKa = 4.19VRR56 pKa = 11.84AEE58 pKa = 3.87DD59 pKa = 5.84LIAQGLDD66 pKa = 3.16FDD68 pKa = 5.14ALLTEE73 pKa = 5.05SGAEE77 pKa = 3.9PGRR80 pKa = 11.84AVDD83 pKa = 3.93LALPVSPVNLCGTACCFAGHH103 pKa = 5.57TTFQVGDD110 pKa = 3.85TPVVNVVANRR120 pKa = 11.84DD121 pKa = 3.71WINTTEE127 pKa = 4.07VLAIMDD133 pKa = 4.33VRR135 pKa = 11.84PVDD138 pKa = 3.62HH139 pKa = 7.66PGLMVPVSTRR149 pKa = 11.84AMEE152 pKa = 4.2LLGLEE157 pKa = 4.13SDD159 pKa = 3.88EE160 pKa = 5.49ADD162 pKa = 4.42LLFEE166 pKa = 5.91ADD168 pKa = 3.45NTLADD173 pKa = 3.54LRR175 pKa = 11.84VIIEE179 pKa = 4.08YY180 pKa = 8.6LTNGVGIVEE189 pKa = 4.56CDD191 pKa = 3.17ACGEE195 pKa = 4.31RR196 pKa = 11.84PWNCPYY202 pKa = 10.7RR203 pKa = 11.84GDD205 pKa = 4.17EE206 pKa = 4.2VCSVCDD212 pKa = 3.78EE213 pKa = 4.74HH214 pKa = 7.89PDD216 pKa = 3.33TCVCYY221 pKa = 10.82SEE223 pKa = 6.13DD224 pKa = 3.61EE225 pKa = 4.2
Molecular weight: 24.44 kDa
Isoelectric point according different methods:
Protein with the highest isoelectric point:
>tr|A0A5Q2WLB7|A0A5Q2WLB7_9CAUD Uncharacterized protein OS=Gordonia phage NHagos OX=2653746 GN=54 PE=4 SV=1
MM1 pKa = 8.05VSMAEE6 pKa = 4.0FSYY9 pKa = 10.31PPIMVRR15 pKa = 11.84SPAHH19 pKa = 5.98VADD22 pKa = 3.58QLKK25 pKa = 10.38RR26 pKa = 11.84RR27 pKa = 11.84LKK29 pKa = 9.74VACAEE34 pKa = 4.29DD35 pKa = 5.49GIAYY39 pKa = 7.52WQFIEE44 pKa = 4.43RR45 pKa = 11.84ALDD48 pKa = 3.47EE49 pKa = 5.05RR50 pKa = 11.84DD51 pKa = 3.03ATMAKK56 pKa = 8.81MRR58 pKa = 11.84HH59 pKa = 5.4PLDD62 pKa = 3.8RR63 pKa = 11.84AALSPKK69 pKa = 10.15AKK71 pKa = 9.67GRR73 pKa = 11.84RR74 pKa = 11.84RR75 pKa = 3.42
MM1 pKa = 8.05VSMAEE6 pKa = 4.0FSYY9 pKa = 10.31PPIMVRR15 pKa = 11.84SPAHH19 pKa = 5.98VADD22 pKa = 3.58QLKK25 pKa = 10.38RR26 pKa = 11.84RR27 pKa = 11.84LKK29 pKa = 9.74VACAEE34 pKa = 4.29DD35 pKa = 5.49GIAYY39 pKa = 7.52WQFIEE44 pKa = 4.43RR45 pKa = 11.84ALDD48 pKa = 3.47EE49 pKa = 5.05RR50 pKa = 11.84DD51 pKa = 3.03ATMAKK56 pKa = 8.81MRR58 pKa = 11.84HH59 pKa = 5.4PLDD62 pKa = 3.8RR63 pKa = 11.84AALSPKK69 pKa = 10.15AKK71 pKa = 9.67GRR73 pKa = 11.84RR74 pKa = 11.84RR75 pKa = 3.42
Molecular weight: 8.61 kDa
Isoelectric point according different methods:
Peptides (in silico digests for buttom-up proteomics)
Below you can find in silico digests of the whole proteome with Trypsin, Chymotrypsin, Trypsin+LysC, LysN, ArgC proteases suitable for different mass spec machines.| Try ESI |
 |
|---|
| ChTry ESI |
 |
|---|
| ArgC ESI |
 |
|---|
| LysN ESI |
 |
|---|
| TryLysC ESI |
 |
|---|
| Try MALDI |
 |
|---|
| ChTry MALDI |
 |
|---|
| ArgC MALDI |
 |
|---|
| LysN MALDI |
 |
|---|
| TryLysC MALDI |
 |
|---|
| Try LTQ |
 |
|---|
| ChTry LTQ |
 |
|---|
| ArgC LTQ |
 |
|---|
| LysN LTQ |
 |
|---|
| TryLysC LTQ |
 |
|---|
| Try MSlow |
 |
|---|
| ChTry MSlow |
 |
|---|
| ArgC MSlow |
 |
|---|
| LysN MSlow |
 |
|---|
| TryLysC MSlow |
 |
|---|
| Try MShigh |
 |
|---|
| ChTry MShigh |
 |
|---|
| ArgC MShigh |
 |
|---|
| LysN MShigh |
 |
|---|
| TryLysC MShigh |
 |
|---|
General Statistics
Number of major isoforms |
Number of additional isoforms |
Number of all proteins |
Number of amino acids |
Min. Seq. Length |
Max. Seq. Length |
Avg. Seq. Length |
Avg. Mol. Weight |
|---|---|---|---|---|---|---|---|
0 |
18948 |
41 |
1956 |
231.1 |
24.97 |
Amino acid frequency
Ala |
Cys |
Asp |
Glu |
Phe |
Gly |
His |
Ile |
Lys |
Leu |
|---|---|---|---|---|---|---|---|---|---|
12.233 ± 0.309 | 0.95 ± 0.144 |
7.236 ± 0.265 | 6.18 ± 0.339 |
2.47 ± 0.148 | 8.798 ± 0.361 |
1.815 ± 0.16 | 4.565 ± 0.293 |
2.565 ± 0.232 | 8.138 ± 0.199 |
Met |
Asn |
Gln |
Pro |
Arg |
Ser |
Thr |
Val |
Trp |
Tyr |
|---|---|---|---|---|---|---|---|---|---|
2.243 ± 0.105 | 2.707 ± 0.216 |
5.404 ± 0.215 | 3.103 ± 0.171 |
6.803 ± 0.387 | 5.795 ± 0.248 |
6.84 ± 0.239 | 7.742 ± 0.179 |
2.021 ± 0.112 | 2.391 ± 0.179 |
Most of the basic statistics you can see at this page can be downloaded from this CSV file
Proteome-pI is available under Creative Commons Attribution-NoDerivs license, for more details see here
| Reference: Kozlowski LP. Proteome-pI 2.0: Proteome Isoelectric Point Database Update. Nucleic Acids Res. 2021, doi: 10.1093/nar/gkab944 | Contact: Lukasz P. Kozlowski |
