marine bacterium AO1-C
Taxonomy: cellular organisms; Bacteria; FCB group; Bacteroidetes/Chlorobi group; Bacteroidetes; Cytophagia; Cytophagales; Cytophagaceae; unclassified Cytophagaceae
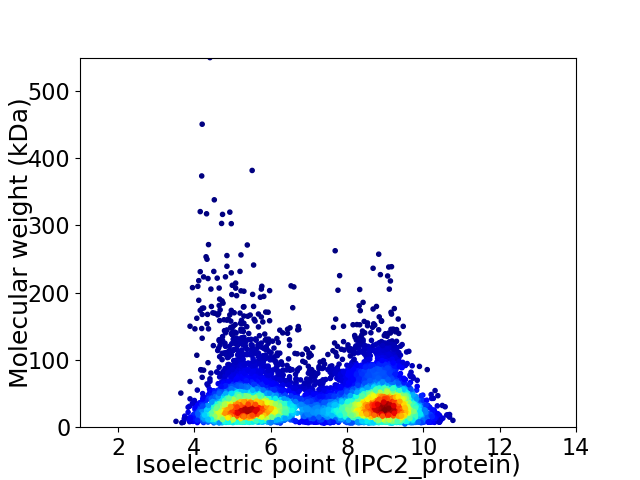
Average proteome isoelectric point is 7.14
Get precalculated fractions of proteins

Virtual 2D-PAGE plot for 8907 proteins (isoelectric point calculated using IPC2_protein)
Get csv file with sequences according to given criteria:
* You can choose from 21 different methods for calculating isoelectric point
Summary statistics related to proteome-wise predictions


Protein with the lowest isoelectric point:
>tr|A0A1Q3GT67|A0A1Q3GT67_9BACT Methionyl-tRNA formyltransferase OS=marine bacterium AO1-C OX=1905359 GN=BKI52_21045 PE=4 SV=1
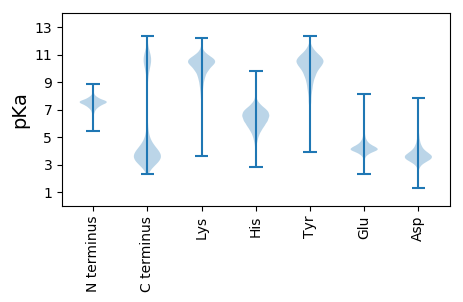
MM1 pKa = 7.47KK2 pKa = 10.41FKK4 pKa = 10.28IYY6 pKa = 10.81NYY8 pKa = 9.26ILCLVASVGMMACEE22 pKa = 4.0DD23 pKa = 4.24VIDD26 pKa = 4.0VTLGDD31 pKa = 4.16STPQLTVDD39 pKa = 3.47AWISNQLTTQTFRR52 pKa = 11.84LSISQDD58 pKa = 3.28YY59 pKa = 10.57FNNNPTAGASGATVVVTDD77 pKa = 4.41NLGNTYY83 pKa = 10.88NFAEE87 pKa = 4.68STANPGNYY95 pKa = 8.58TSNFQGAVDD104 pKa = 3.43VTYY107 pKa = 9.97TLNVQYY113 pKa = 10.4QGQEE117 pKa = 3.99YY118 pKa = 9.85QATTTLSRR126 pKa = 11.84VPPIDD131 pKa = 3.31SLVFTKK137 pKa = 10.77AEE139 pKa = 4.07EE140 pKa = 4.2ADD142 pKa = 3.76GGPGSVSTGYY152 pKa = 9.82QAEE155 pKa = 4.54FFATDD160 pKa = 3.12IPGVGDD166 pKa = 3.82FYY168 pKa = 11.09RR169 pKa = 11.84IKK171 pKa = 9.75TYY173 pKa = 11.05QNGVLMNKK181 pKa = 9.95PSDD184 pKa = 3.51LTSFQDD190 pKa = 3.82LNVDD194 pKa = 4.04GLPFILPVRR203 pKa = 11.84LSINPTNEE211 pKa = 3.83DD212 pKa = 2.89NDD214 pKa = 3.94GFKK217 pKa = 10.57QGDD220 pKa = 3.82MVKK223 pKa = 10.37VEE225 pKa = 4.44LLSISEE231 pKa = 4.06EE232 pKa = 3.78AFLFFDD238 pKa = 4.43QLEE241 pKa = 4.5TQTNNGGLFADD252 pKa = 6.06PIANVPTNISNVNPSGPKK270 pKa = 9.93AVGFFYY276 pKa = 10.9ASGVSTIEE284 pKa = 5.16GIAQQ288 pKa = 3.32
MM1 pKa = 7.47KK2 pKa = 10.41FKK4 pKa = 10.28IYY6 pKa = 10.81NYY8 pKa = 9.26ILCLVASVGMMACEE22 pKa = 4.0DD23 pKa = 4.24VIDD26 pKa = 4.0VTLGDD31 pKa = 4.16STPQLTVDD39 pKa = 3.47AWISNQLTTQTFRR52 pKa = 11.84LSISQDD58 pKa = 3.28YY59 pKa = 10.57FNNNPTAGASGATVVVTDD77 pKa = 4.41NLGNTYY83 pKa = 10.88NFAEE87 pKa = 4.68STANPGNYY95 pKa = 8.58TSNFQGAVDD104 pKa = 3.43VTYY107 pKa = 9.97TLNVQYY113 pKa = 10.4QGQEE117 pKa = 3.99YY118 pKa = 9.85QATTTLSRR126 pKa = 11.84VPPIDD131 pKa = 3.31SLVFTKK137 pKa = 10.77AEE139 pKa = 4.07EE140 pKa = 4.2ADD142 pKa = 3.76GGPGSVSTGYY152 pKa = 9.82QAEE155 pKa = 4.54FFATDD160 pKa = 3.12IPGVGDD166 pKa = 3.82FYY168 pKa = 11.09RR169 pKa = 11.84IKK171 pKa = 9.75TYY173 pKa = 11.05QNGVLMNKK181 pKa = 9.95PSDD184 pKa = 3.51LTSFQDD190 pKa = 3.82LNVDD194 pKa = 4.04GLPFILPVRR203 pKa = 11.84LSINPTNEE211 pKa = 3.83DD212 pKa = 2.89NDD214 pKa = 3.94GFKK217 pKa = 10.57QGDD220 pKa = 3.82MVKK223 pKa = 10.37VEE225 pKa = 4.44LLSISEE231 pKa = 4.06EE232 pKa = 3.78AFLFFDD238 pKa = 4.43QLEE241 pKa = 4.5TQTNNGGLFADD252 pKa = 6.06PIANVPTNISNVNPSGPKK270 pKa = 9.93AVGFFYY276 pKa = 10.9ASGVSTIEE284 pKa = 5.16GIAQQ288 pKa = 3.32
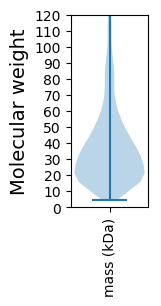
Molecular weight: 31.11 kDa
Isoelectric point according different methods:
Protein with the highest isoelectric point:
>tr|A0A1Q3H3S3|A0A1Q3H3S3_9BACT Uncharacterized protein OS=marine bacterium AO1-C OX=1905359 GN=BKI52_04125 PE=4 SV=1
MM1 pKa = 7.75GKK3 pKa = 9.74RR4 pKa = 11.84LLRR7 pKa = 11.84RR8 pKa = 11.84LGSKK12 pKa = 10.26SFIFCDD18 pKa = 4.94PIAHH22 pKa = 5.91EE23 pKa = 4.58TSQKK27 pKa = 10.23EE28 pKa = 3.86YY29 pKa = 10.83FRR31 pKa = 11.84AGRR34 pKa = 11.84CALFWLLLLGSAATILILRR53 pKa = 11.84SRR55 pKa = 11.84TTGAGMSLIFPILITGLGAIVMFGLTFYY83 pKa = 10.68HH84 pKa = 6.15FVVGMFLL91 pKa = 3.51
MM1 pKa = 7.75GKK3 pKa = 9.74RR4 pKa = 11.84LLRR7 pKa = 11.84RR8 pKa = 11.84LGSKK12 pKa = 10.26SFIFCDD18 pKa = 4.94PIAHH22 pKa = 5.91EE23 pKa = 4.58TSQKK27 pKa = 10.23EE28 pKa = 3.86YY29 pKa = 10.83FRR31 pKa = 11.84AGRR34 pKa = 11.84CALFWLLLLGSAATILILRR53 pKa = 11.84SRR55 pKa = 11.84TTGAGMSLIFPILITGLGAIVMFGLTFYY83 pKa = 10.68HH84 pKa = 6.15FVVGMFLL91 pKa = 3.51
Molecular weight: 10.13 kDa
Isoelectric point according different methods:
Peptides (in silico digests for buttom-up proteomics)
Below you can find in silico digests of the whole proteome with Trypsin, Chymotrypsin, Trypsin+LysC, LysN, ArgC proteases suitable for different mass spec machines.| Try ESI |
 |
|---|
| ChTry ESI |
 |
|---|
| ArgC ESI |
 |
|---|
| LysN ESI |
 |
|---|
| TryLysC ESI |
 |
|---|
| Try MALDI |
 |
|---|
| ChTry MALDI |
 |
|---|
| ArgC MALDI |
 |
|---|
| LysN MALDI |
 |
|---|
| TryLysC MALDI |
 |
|---|
| Try LTQ |
 |
|---|
| ChTry LTQ |
 |
|---|
| ArgC LTQ |
 |
|---|
| LysN LTQ |
 |
|---|
| TryLysC LTQ |
 |
|---|
| Try MSlow |
 |
|---|
| ChTry MSlow |
 |
|---|
| ArgC MSlow |
 |
|---|
| LysN MSlow |
 |
|---|
| TryLysC MSlow |
 |
|---|
| Try MShigh |
 |
|---|
| ChTry MShigh |
 |
|---|
| ArgC MShigh |
 |
|---|
| LysN MShigh |
 |
|---|
| TryLysC MShigh |
 |
|---|
General Statistics
Number of major isoforms |
Number of additional isoforms |
Number of all proteins |
Number of amino acids |
Min. Seq. Length |
Max. Seq. Length |
Avg. Seq. Length |
Avg. Mol. Weight |
|---|---|---|---|---|---|---|---|
0 |
3210568 |
42 |
4790 |
360.5 |
40.83 |
Amino acid frequency
Ala |
Cys |
Asp |
Glu |
Phe |
Gly |
His |
Ile |
Lys |
Leu |
|---|---|---|---|---|---|---|---|---|---|
6.792 ± 0.024 | 0.711 ± 0.008 |
4.972 ± 0.019 | 5.896 ± 0.033 |
4.919 ± 0.02 | 6.286 ± 0.034 |
1.981 ± 0.012 | 6.896 ± 0.019 |
7.684 ± 0.041 | 9.871 ± 0.039 |
Met |
Asn |
Gln |
Pro |
Arg |
Ser |
Thr |
Val |
Trp |
Tyr |
|---|---|---|---|---|---|---|---|---|---|
2.128 ± 0.013 | 5.683 ± 0.027 |
3.628 ± 0.017 | 5.008 ± 0.026 |
4.07 ± 0.016 | 6.051 ± 0.023 |
5.94 ± 0.041 | 6.102 ± 0.021 |
1.244 ± 0.009 | 4.136 ± 0.02 |
Most of the basic statistics you can see at this page can be downloaded from this CSV file
Proteome-pI is available under Creative Commons Attribution-NoDerivs license, for more details see here
| Reference: Kozlowski LP. Proteome-pI 2.0: Proteome Isoelectric Point Database Update. Nucleic Acids Res. 2021, doi: 10.1093/nar/gkab944 | Contact: Lukasz P. Kozlowski |
