Tessaracoccus oleiagri
Taxonomy: cellular organisms; Bacteria; Terrabacteria group; Actinobacteria; Actinomycetia; Propionibacteriales; Propionibacteriaceae; Tessaracoccus
Average proteome isoelectric point is 5.97
Get precalculated fractions of proteins

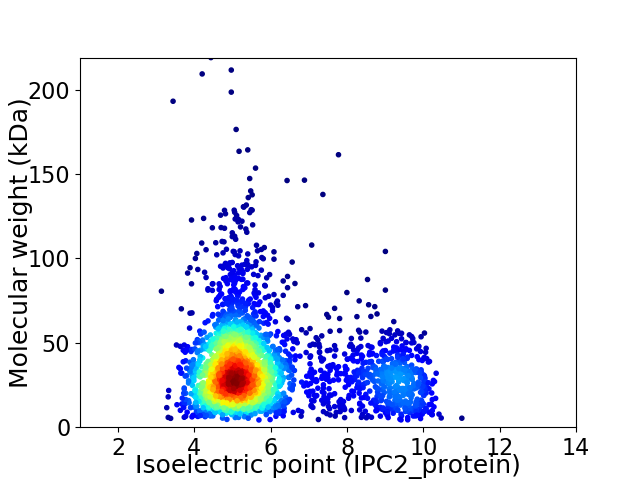
Virtual 2D-PAGE plot for 2895 proteins (isoelectric point calculated using IPC2_protein)
Get csv file with sequences according to given criteria:
* You can choose from 21 different methods for calculating isoelectric point
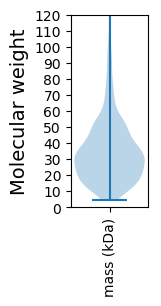
Summary statistics related to proteome-wise predictions


Protein with the lowest isoelectric point:
>tr|A0A1G9M0T7|A0A1G9M0T7_9ACTN 8-oxo-dGTP pyrophosphatase MutT NUDIX family OS=Tessaracoccus oleiagri OX=686624 GN=SAMN04488242_2447 PE=3 SV=1
MM1 pKa = 7.06NQPAVLVAALLTLTLSACSDD21 pKa = 3.87ANDD24 pKa = 3.52SSGIGAEE31 pKa = 4.07PASRR35 pKa = 11.84AASCEE40 pKa = 3.97YY41 pKa = 10.32PEE43 pKa = 5.78DD44 pKa = 4.15GQPVKK49 pKa = 10.44PVDD52 pKa = 4.21PPPSTDD58 pKa = 3.08VANKK62 pKa = 8.15GTTTATLQLTAGDD75 pKa = 3.88IEE77 pKa = 4.22ITLDD81 pKa = 3.89RR82 pKa = 11.84EE83 pKa = 4.2KK84 pKa = 11.11APCAVNSFLSLAQQGYY100 pKa = 10.5FDD102 pKa = 4.07GTDD105 pKa = 3.24CHH107 pKa = 7.06RR108 pKa = 11.84LTDD111 pKa = 3.69YY112 pKa = 11.53GIFILQCGDD121 pKa = 3.4PSATGRR127 pKa = 11.84GGPGYY132 pKa = 10.82VFADD136 pKa = 3.94EE137 pKa = 4.76VSDD140 pKa = 3.88DD141 pKa = 4.08LEE143 pKa = 4.52YY144 pKa = 10.88TSGTVAMANRR154 pKa = 11.84GPDD157 pKa = 3.39TNGSQFFLVWDD168 pKa = 4.9DD169 pKa = 4.06SQLDD173 pKa = 3.39PAYY176 pKa = 9.56TVFGQMDD183 pKa = 3.99EE184 pKa = 4.62AGLDD188 pKa = 3.62VVRR191 pKa = 11.84GIAAQGVDD199 pKa = 3.91AGDD202 pKa = 3.71GTSPIAEE209 pKa = 3.86ARR211 pKa = 11.84IEE213 pKa = 4.17GVTVGG218 pKa = 4.11
MM1 pKa = 7.06NQPAVLVAALLTLTLSACSDD21 pKa = 3.87ANDD24 pKa = 3.52SSGIGAEE31 pKa = 4.07PASRR35 pKa = 11.84AASCEE40 pKa = 3.97YY41 pKa = 10.32PEE43 pKa = 5.78DD44 pKa = 4.15GQPVKK49 pKa = 10.44PVDD52 pKa = 4.21PPPSTDD58 pKa = 3.08VANKK62 pKa = 8.15GTTTATLQLTAGDD75 pKa = 3.88IEE77 pKa = 4.22ITLDD81 pKa = 3.89RR82 pKa = 11.84EE83 pKa = 4.2KK84 pKa = 11.11APCAVNSFLSLAQQGYY100 pKa = 10.5FDD102 pKa = 4.07GTDD105 pKa = 3.24CHH107 pKa = 7.06RR108 pKa = 11.84LTDD111 pKa = 3.69YY112 pKa = 11.53GIFILQCGDD121 pKa = 3.4PSATGRR127 pKa = 11.84GGPGYY132 pKa = 10.82VFADD136 pKa = 3.94EE137 pKa = 4.76VSDD140 pKa = 3.88DD141 pKa = 4.08LEE143 pKa = 4.52YY144 pKa = 10.88TSGTVAMANRR154 pKa = 11.84GPDD157 pKa = 3.39TNGSQFFLVWDD168 pKa = 4.9DD169 pKa = 4.06SQLDD173 pKa = 3.39PAYY176 pKa = 9.56TVFGQMDD183 pKa = 3.99EE184 pKa = 4.62AGLDD188 pKa = 3.62VVRR191 pKa = 11.84GIAAQGVDD199 pKa = 3.91AGDD202 pKa = 3.71GTSPIAEE209 pKa = 3.86ARR211 pKa = 11.84IEE213 pKa = 4.17GVTVGG218 pKa = 4.11
Molecular weight: 22.53 kDa
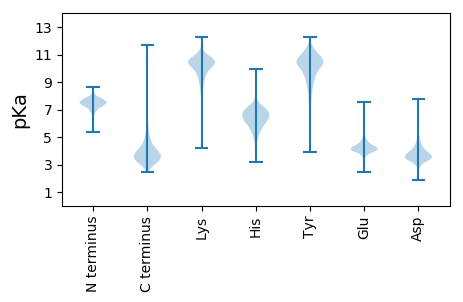
Isoelectric point according different methods:
Protein with the highest isoelectric point:
>tr|A0A1G9I2E2|A0A1G9I2E2_9ACTN DNA ligase (ATP) OS=Tessaracoccus oleiagri OX=686624 GN=SAMN04488242_0685 PE=4 SV=1
MM1 pKa = 7.69SKK3 pKa = 9.01RR4 pKa = 11.84TFQPSNRR11 pKa = 11.84RR12 pKa = 11.84RR13 pKa = 11.84SRR15 pKa = 11.84THH17 pKa = 6.17GFRR20 pKa = 11.84SRR22 pKa = 11.84MRR24 pKa = 11.84TRR26 pKa = 11.84AGRR29 pKa = 11.84AILAARR35 pKa = 11.84RR36 pKa = 11.84RR37 pKa = 11.84KK38 pKa = 10.21GRR40 pKa = 11.84VEE42 pKa = 4.17LSAA45 pKa = 5.19
MM1 pKa = 7.69SKK3 pKa = 9.01RR4 pKa = 11.84TFQPSNRR11 pKa = 11.84RR12 pKa = 11.84RR13 pKa = 11.84SRR15 pKa = 11.84THH17 pKa = 6.17GFRR20 pKa = 11.84SRR22 pKa = 11.84MRR24 pKa = 11.84TRR26 pKa = 11.84AGRR29 pKa = 11.84AILAARR35 pKa = 11.84RR36 pKa = 11.84RR37 pKa = 11.84KK38 pKa = 10.21GRR40 pKa = 11.84VEE42 pKa = 4.17LSAA45 pKa = 5.19
Molecular weight: 5.33 kDa
Isoelectric point according different methods:
Peptides (in silico digests for buttom-up proteomics)
Below you can find in silico digests of the whole proteome with Trypsin, Chymotrypsin, Trypsin+LysC, LysN, ArgC proteases suitable for different mass spec machines.| Try ESI |
 |
|---|
| ChTry ESI |
 |
|---|
| ArgC ESI |
 |
|---|
| LysN ESI |
 |
|---|
| TryLysC ESI |
 |
|---|
| Try MALDI |
 |
|---|
| ChTry MALDI |
 |
|---|
| ArgC MALDI |
 |
|---|
| LysN MALDI |
 |
|---|
| TryLysC MALDI |
 |
|---|
| Try LTQ |
 |
|---|
| ChTry LTQ |
 |
|---|
| ArgC LTQ |
 |
|---|
| LysN LTQ |
 |
|---|
| TryLysC LTQ |
 |
|---|
| Try MSlow |
 |
|---|
| ChTry MSlow |
 |
|---|
| ArgC MSlow |
 |
|---|
| LysN MSlow |
 |
|---|
| TryLysC MSlow |
 |
|---|
| Try MShigh |
 |
|---|
| ChTry MShigh |
 |
|---|
| ArgC MShigh |
 |
|---|
| LysN MShigh |
 |
|---|
| TryLysC MShigh |
 |
|---|
General Statistics
Number of major isoforms |
Number of additional isoforms |
Number of all proteins |
Number of amino acids |
Min. Seq. Length |
Max. Seq. Length |
Avg. Seq. Length |
Avg. Mol. Weight |
|---|---|---|---|---|---|---|---|
0 |
980936 |
37 |
2065 |
338.8 |
36.63 |
Amino acid frequency
Ala |
Cys |
Asp |
Glu |
Phe |
Gly |
His |
Ile |
Lys |
Leu |
|---|---|---|---|---|---|---|---|---|---|
12.263 ± 0.066 | 0.613 ± 0.012 |
6.216 ± 0.038 | 6.28 ± 0.042 |
3.183 ± 0.03 | 8.892 ± 0.036 |
2.164 ± 0.021 | 4.211 ± 0.034 |
2.24 ± 0.033 | 10.291 ± 0.045 |
Met |
Asn |
Gln |
Pro |
Arg |
Ser |
Thr |
Val |
Trp |
Tyr |
|---|---|---|---|---|---|---|---|---|---|
2.094 ± 0.019 | 2.083 ± 0.024 |
5.407 ± 0.034 | 2.946 ± 0.022 |
7.378 ± 0.054 | 5.289 ± 0.031 |
5.783 ± 0.035 | 8.965 ± 0.039 |
1.592 ± 0.02 | 2.11 ± 0.022 |
Most of the basic statistics you can see at this page can be downloaded from this CSV file
Proteome-pI is available under Creative Commons Attribution-NoDerivs license, for more details see here
| Reference: Kozlowski LP. Proteome-pI 2.0: Proteome Isoelectric Point Database Update. Nucleic Acids Res. 2021, doi: 10.1093/nar/gkab944 | Contact: Lukasz P. Kozlowski |
