Halarsenatibacter silvermanii
Taxonomy: cellular organisms; Bacteria; Terrabacteria group; Firmicutes; Clostridia; Halanaerobiales; Halanaerobiaceae; Halarsenatibacter
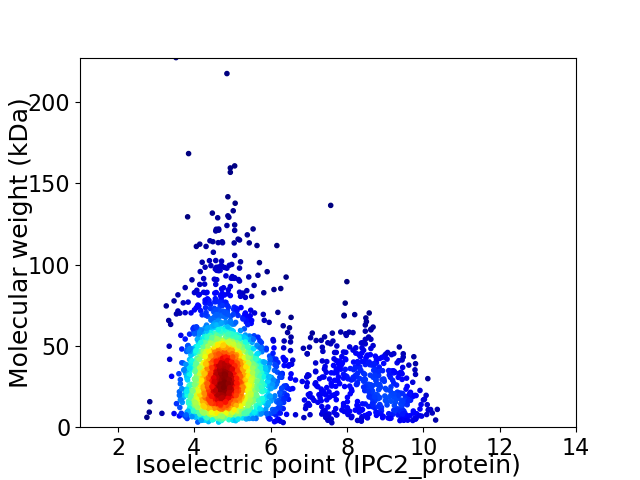
Average proteome isoelectric point is 5.51
Get precalculated fractions of proteins

Virtual 2D-PAGE plot for 2587 proteins (isoelectric point calculated using IPC2_protein)
Get csv file with sequences according to given criteria:
* You can choose from 21 different methods for calculating isoelectric point
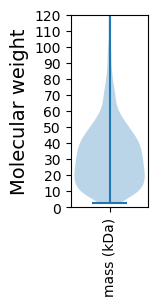
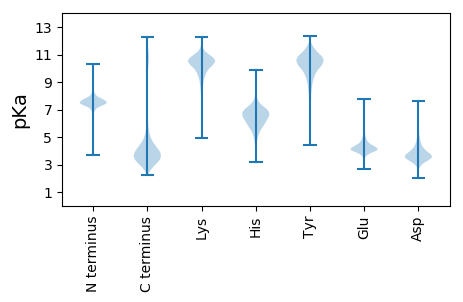
Summary statistics related to proteome-wise predictions


Protein with the lowest isoelectric point:
>tr|A0A1G9GXZ1|A0A1G9GXZ1_9FIRM Uncharacterized protein OS=Halarsenatibacter silvermanii OX=321763 GN=SAMN04488692_10139 PE=4 SV=1
MM1 pKa = 7.43LKK3 pKa = 10.17KK4 pKa = 10.75VSLSLALMLVIGLVFTVPAMAEE26 pKa = 3.87EE27 pKa = 5.01DD28 pKa = 3.7PLVIYY33 pKa = 7.21FFPGGPEE40 pKa = 3.94GGPFSTIVYY49 pKa = 9.99NGADD53 pKa = 3.54YY54 pKa = 11.33ADD56 pKa = 4.2EE57 pKa = 4.21VLGDD61 pKa = 3.84RR62 pKa = 11.84VDD64 pKa = 3.4VRR66 pKa = 11.84YY67 pKa = 9.65RR68 pKa = 11.84WSDD71 pKa = 3.01WSPEE75 pKa = 3.83QMVTQFQEE83 pKa = 4.19AVAANPDD90 pKa = 3.9GIAIMGHH97 pKa = 6.65PGDD100 pKa = 5.09DD101 pKa = 3.12ALEE104 pKa = 4.01PHH106 pKa = 6.35VEE108 pKa = 3.93NAKK111 pKa = 9.88EE112 pKa = 3.77QGITVTSQNTTLPALEE128 pKa = 4.23EE129 pKa = 4.41RR130 pKa = 11.84YY131 pKa = 9.86VDD133 pKa = 3.59EE134 pKa = 4.83GFGYY138 pKa = 10.66AGQDD142 pKa = 3.67LYY144 pKa = 11.67DD145 pKa = 3.66SGYY148 pKa = 8.94MLGEE152 pKa = 4.04AAVEE156 pKa = 3.86RR157 pKa = 11.84AEE159 pKa = 4.85LGEE162 pKa = 4.33GDD164 pKa = 4.52SAFIWGLKK172 pKa = 8.49AQPEE176 pKa = 4.26RR177 pKa = 11.84GQRR180 pKa = 11.84TQGAVDD186 pKa = 3.44AVEE189 pKa = 4.08EE190 pKa = 4.32AGVEE194 pKa = 3.89VDD196 pKa = 3.5YY197 pKa = 11.31MEE199 pKa = 5.03ISSEE203 pKa = 3.91VDD205 pKa = 2.72ADD207 pKa = 3.62ASAGIPVISGYY218 pKa = 10.25LAEE221 pKa = 5.52NPDD224 pKa = 3.83TDD226 pKa = 5.64LVITDD231 pKa = 4.43HH232 pKa = 6.77GALTSTMDD240 pKa = 3.58TYY242 pKa = 11.48FEE244 pKa = 4.33AAGKK248 pKa = 10.04EE249 pKa = 3.73PGEE252 pKa = 4.02IYY254 pKa = 10.75GAGFDD259 pKa = 4.89LSTATLDD266 pKa = 4.51AIQEE270 pKa = 4.57GYY272 pKa = 9.12VQLVHH277 pKa = 6.91DD278 pKa = 4.63QQPFLQGFLPIMQIYY293 pKa = 10.09ISEE296 pKa = 4.19NYY298 pKa = 8.92EE299 pKa = 3.76FSGLHH304 pKa = 6.39IDD306 pKa = 3.6TGSGLVHH313 pKa = 7.06EE314 pKa = 5.67DD315 pKa = 3.42NVDD318 pKa = 3.33VLAPLVEE325 pKa = 4.19EE326 pKa = 5.51GIRR329 pKa = 3.51
MM1 pKa = 7.43LKK3 pKa = 10.17KK4 pKa = 10.75VSLSLALMLVIGLVFTVPAMAEE26 pKa = 3.87EE27 pKa = 5.01DD28 pKa = 3.7PLVIYY33 pKa = 7.21FFPGGPEE40 pKa = 3.94GGPFSTIVYY49 pKa = 9.99NGADD53 pKa = 3.54YY54 pKa = 11.33ADD56 pKa = 4.2EE57 pKa = 4.21VLGDD61 pKa = 3.84RR62 pKa = 11.84VDD64 pKa = 3.4VRR66 pKa = 11.84YY67 pKa = 9.65RR68 pKa = 11.84WSDD71 pKa = 3.01WSPEE75 pKa = 3.83QMVTQFQEE83 pKa = 4.19AVAANPDD90 pKa = 3.9GIAIMGHH97 pKa = 6.65PGDD100 pKa = 5.09DD101 pKa = 3.12ALEE104 pKa = 4.01PHH106 pKa = 6.35VEE108 pKa = 3.93NAKK111 pKa = 9.88EE112 pKa = 3.77QGITVTSQNTTLPALEE128 pKa = 4.23EE129 pKa = 4.41RR130 pKa = 11.84YY131 pKa = 9.86VDD133 pKa = 3.59EE134 pKa = 4.83GFGYY138 pKa = 10.66AGQDD142 pKa = 3.67LYY144 pKa = 11.67DD145 pKa = 3.66SGYY148 pKa = 8.94MLGEE152 pKa = 4.04AAVEE156 pKa = 3.86RR157 pKa = 11.84AEE159 pKa = 4.85LGEE162 pKa = 4.33GDD164 pKa = 4.52SAFIWGLKK172 pKa = 8.49AQPEE176 pKa = 4.26RR177 pKa = 11.84GQRR180 pKa = 11.84TQGAVDD186 pKa = 3.44AVEE189 pKa = 4.08EE190 pKa = 4.32AGVEE194 pKa = 3.89VDD196 pKa = 3.5YY197 pKa = 11.31MEE199 pKa = 5.03ISSEE203 pKa = 3.91VDD205 pKa = 2.72ADD207 pKa = 3.62ASAGIPVISGYY218 pKa = 10.25LAEE221 pKa = 5.52NPDD224 pKa = 3.83TDD226 pKa = 5.64LVITDD231 pKa = 4.43HH232 pKa = 6.77GALTSTMDD240 pKa = 3.58TYY242 pKa = 11.48FEE244 pKa = 4.33AAGKK248 pKa = 10.04EE249 pKa = 3.73PGEE252 pKa = 4.02IYY254 pKa = 10.75GAGFDD259 pKa = 4.89LSTATLDD266 pKa = 4.51AIQEE270 pKa = 4.57GYY272 pKa = 9.12VQLVHH277 pKa = 6.91DD278 pKa = 4.63QQPFLQGFLPIMQIYY293 pKa = 10.09ISEE296 pKa = 4.19NYY298 pKa = 8.92EE299 pKa = 3.76FSGLHH304 pKa = 6.39IDD306 pKa = 3.6TGSGLVHH313 pKa = 7.06EE314 pKa = 5.67DD315 pKa = 3.42NVDD318 pKa = 3.33VLAPLVEE325 pKa = 4.19EE326 pKa = 5.51GIRR329 pKa = 3.51
Molecular weight: 35.53 kDa
Isoelectric point according different methods:
Protein with the highest isoelectric point:
>tr|A0A1G9Q6X6|A0A1G9Q6X6_9FIRM Uncharacterized protein OS=Halarsenatibacter silvermanii OX=321763 GN=SAMN04488692_11569 PE=4 SV=1
MM1 pKa = 7.73IKK3 pKa = 10.32RR4 pKa = 11.84LFRR7 pKa = 11.84RR8 pKa = 11.84IFLLLIGIYY17 pKa = 9.69QRR19 pKa = 11.84FISPMLPGSCRR30 pKa = 11.84FYY32 pKa = 9.69PTCSSYY38 pKa = 10.41TRR40 pKa = 11.84QAIEE44 pKa = 4.05KK45 pKa = 8.7YY46 pKa = 10.76GPFKK50 pKa = 10.44GVWMGIKK57 pKa = 9.97RR58 pKa = 11.84ISRR61 pKa = 11.84CHH63 pKa = 6.12PFNPGGIDD71 pKa = 3.37PVEE74 pKa = 3.8
MM1 pKa = 7.73IKK3 pKa = 10.32RR4 pKa = 11.84LFRR7 pKa = 11.84RR8 pKa = 11.84IFLLLIGIYY17 pKa = 9.69QRR19 pKa = 11.84FISPMLPGSCRR30 pKa = 11.84FYY32 pKa = 9.69PTCSSYY38 pKa = 10.41TRR40 pKa = 11.84QAIEE44 pKa = 4.05KK45 pKa = 8.7YY46 pKa = 10.76GPFKK50 pKa = 10.44GVWMGIKK57 pKa = 9.97RR58 pKa = 11.84ISRR61 pKa = 11.84CHH63 pKa = 6.12PFNPGGIDD71 pKa = 3.37PVEE74 pKa = 3.8
Molecular weight: 8.66 kDa
Isoelectric point according different methods:
Peptides (in silico digests for buttom-up proteomics)
Below you can find in silico digests of the whole proteome with Trypsin, Chymotrypsin, Trypsin+LysC, LysN, ArgC proteases suitable for different mass spec machines.| Try ESI |
 |
|---|
| ChTry ESI |
 |
|---|
| ArgC ESI |
 |
|---|
| LysN ESI |
 |
|---|
| TryLysC ESI |
 |
|---|
| Try MALDI |
 |
|---|
| ChTry MALDI |
 |
|---|
| ArgC MALDI |
 |
|---|
| LysN MALDI |
 |
|---|
| TryLysC MALDI |
 |
|---|
| Try LTQ |
 |
|---|
| ChTry LTQ |
 |
|---|
| ArgC LTQ |
 |
|---|
| LysN LTQ |
 |
|---|
| TryLysC LTQ |
 |
|---|
| Try MSlow |
 |
|---|
| ChTry MSlow |
 |
|---|
| ArgC MSlow |
 |
|---|
| LysN MSlow |
 |
|---|
| TryLysC MSlow |
 |
|---|
| Try MShigh |
 |
|---|
| ChTry MShigh |
 |
|---|
| ArgC MShigh |
 |
|---|
| LysN MShigh |
 |
|---|
| TryLysC MShigh |
 |
|---|
General Statistics
Number of major isoforms |
Number of additional isoforms |
Number of all proteins |
Number of amino acids |
Min. Seq. Length |
Max. Seq. Length |
Avg. Seq. Length |
Avg. Mol. Weight |
|---|---|---|---|---|---|---|---|
0 |
792929 |
25 |
2051 |
306.5 |
34.39 |
Amino acid frequency
Ala |
Cys |
Asp |
Glu |
Phe |
Gly |
His |
Ile |
Lys |
Leu |
|---|---|---|---|---|---|---|---|---|---|
7.28 ± 0.051 | 0.899 ± 0.02 |
6.394 ± 0.044 | 10.265 ± 0.075 |
4.067 ± 0.037 | 7.377 ± 0.044 |
1.669 ± 0.02 | 7.36 ± 0.043 |
5.666 ± 0.064 | 9.884 ± 0.056 |
Met |
Asn |
Gln |
Pro |
Arg |
Ser |
Thr |
Val |
Trp |
Tyr |
|---|---|---|---|---|---|---|---|---|---|
2.554 ± 0.023 | 3.895 ± 0.036 |
3.694 ± 0.03 | 2.999 ± 0.024 |
5.461 ± 0.043 | 6.037 ± 0.035 |
4.285 ± 0.031 | 6.283 ± 0.041 |
0.801 ± 0.015 | 3.13 ± 0.03 |
Most of the basic statistics you can see at this page can be downloaded from this CSV file
Proteome-pI is available under Creative Commons Attribution-NoDerivs license, for more details see here
| Reference: Kozlowski LP. Proteome-pI 2.0: Proteome Isoelectric Point Database Update. Nucleic Acids Res. 2021, doi: 10.1093/nar/gkab944 | Contact: Lukasz P. Kozlowski |
