Castlerea virus
Taxonomy: Viruses; Riboviria; unclassified Riboviria; unclassified ssRNA viruses; unclassified ssRNA positive-strand viruses; Negevirus
Average proteome isoelectric point is 7.2
Get precalculated fractions of proteins

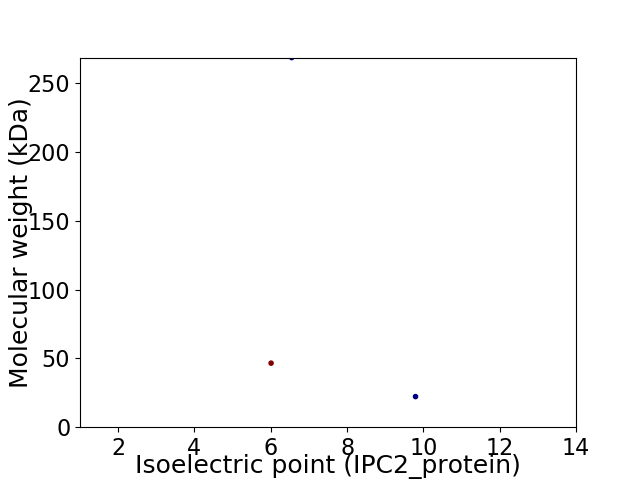
Virtual 2D-PAGE plot for 3 proteins (isoelectric point calculated using IPC2_protein)
Get csv file with sequences according to given criteria:
* You can choose from 21 different methods for calculating isoelectric point
Summary statistics related to proteome-wise predictions


Protein with the lowest isoelectric point:
>tr|A0A1W5S5K3|A0A1W5S5K3_9VIRU ORF2 OS=Castlerea virus OX=1969351 PE=4 SV=1
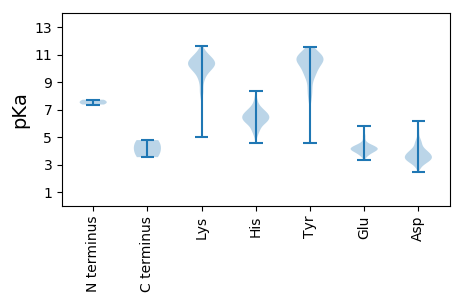
MM1 pKa = 7.53NFPLTVSFLLHH12 pKa = 6.04FVALVHH18 pKa = 6.56SAVFKK23 pKa = 11.28NDD25 pKa = 3.15VLNQFPSTRR34 pKa = 11.84QKK36 pKa = 10.5NAFYY40 pKa = 10.67QKK42 pKa = 10.38LIPHH46 pKa = 7.04LEE48 pKa = 3.91PLGEE52 pKa = 4.23FEE54 pKa = 4.02IAPYY58 pKa = 10.79AFNPEE63 pKa = 4.24CLSVYY68 pKa = 8.85RR69 pKa = 11.84TNDD72 pKa = 2.55WFYY75 pKa = 10.92SQCALPSNCSEE86 pKa = 3.84PSVIKK91 pKa = 10.57LEE93 pKa = 4.09RR94 pKa = 11.84SFFGQEE100 pKa = 3.65TVICHH105 pKa = 6.61SDD107 pKa = 3.18LKK109 pKa = 10.85HH110 pKa = 5.9SRR112 pKa = 11.84KK113 pKa = 9.74DD114 pKa = 3.19VYY116 pKa = 11.35EE117 pKa = 3.96FFTPKK122 pKa = 10.22FVPKK126 pKa = 10.42NLTLRR131 pKa = 11.84DD132 pKa = 4.29PISILGNNFNLLTNLTPVSFFEE154 pKa = 3.65WFYY157 pKa = 10.86IVKK160 pKa = 10.31SADD163 pKa = 2.9GRR165 pKa = 11.84YY166 pKa = 9.89GLLPRR171 pKa = 11.84ICDD174 pKa = 3.37EE175 pKa = 3.83THH177 pKa = 6.77RR178 pKa = 11.84NSTHH182 pKa = 6.16LPKK185 pKa = 10.49NVHH188 pKa = 6.34LEE190 pKa = 4.16HH191 pKa = 7.11NGDD194 pKa = 3.81RR195 pKa = 11.84VCLIEE200 pKa = 4.08TSYY203 pKa = 8.1TTHH206 pKa = 5.95SCIPKK211 pKa = 9.67LYY213 pKa = 10.64NSIFTLLQLYY223 pKa = 8.36DD224 pKa = 4.01FPIEE228 pKa = 3.84FDD230 pKa = 3.83GVPFSQGSFSLTNNKK245 pKa = 9.52VIGADD250 pKa = 3.51SYY252 pKa = 10.26ITNSVGKK259 pKa = 8.29TPIVVDD265 pKa = 3.93KK266 pKa = 11.6VGGSYY271 pKa = 10.0MLTYY275 pKa = 10.78EE276 pKa = 4.73SFDD279 pKa = 4.02SNQPFYY285 pKa = 10.58IVRR288 pKa = 11.84NQRR291 pKa = 11.84HH292 pKa = 6.16LPTEE296 pKa = 3.64NHH298 pKa = 5.05QCFNLLSHH306 pKa = 6.63YY307 pKa = 10.51SSPLTSIFHH316 pKa = 6.87HH317 pKa = 6.67ISTFIRR323 pKa = 11.84KK324 pKa = 8.09EE325 pKa = 3.49LSYY328 pKa = 10.99LVEE331 pKa = 4.23FLKK334 pKa = 10.94QLAGEE339 pKa = 4.0IALILFKK346 pKa = 10.5IVSEE350 pKa = 3.97LFEE353 pKa = 5.08IFMSLIPYY361 pKa = 9.85NSEE364 pKa = 4.02FYY366 pKa = 10.49TSLFVMTLTYY376 pKa = 10.69FNTRR380 pKa = 11.84DD381 pKa = 3.36IPISCVVFVGVYY393 pKa = 8.4VFKK396 pKa = 10.57IYY398 pKa = 7.6MTSFII403 pKa = 4.78
MM1 pKa = 7.53NFPLTVSFLLHH12 pKa = 6.04FVALVHH18 pKa = 6.56SAVFKK23 pKa = 11.28NDD25 pKa = 3.15VLNQFPSTRR34 pKa = 11.84QKK36 pKa = 10.5NAFYY40 pKa = 10.67QKK42 pKa = 10.38LIPHH46 pKa = 7.04LEE48 pKa = 3.91PLGEE52 pKa = 4.23FEE54 pKa = 4.02IAPYY58 pKa = 10.79AFNPEE63 pKa = 4.24CLSVYY68 pKa = 8.85RR69 pKa = 11.84TNDD72 pKa = 2.55WFYY75 pKa = 10.92SQCALPSNCSEE86 pKa = 3.84PSVIKK91 pKa = 10.57LEE93 pKa = 4.09RR94 pKa = 11.84SFFGQEE100 pKa = 3.65TVICHH105 pKa = 6.61SDD107 pKa = 3.18LKK109 pKa = 10.85HH110 pKa = 5.9SRR112 pKa = 11.84KK113 pKa = 9.74DD114 pKa = 3.19VYY116 pKa = 11.35EE117 pKa = 3.96FFTPKK122 pKa = 10.22FVPKK126 pKa = 10.42NLTLRR131 pKa = 11.84DD132 pKa = 4.29PISILGNNFNLLTNLTPVSFFEE154 pKa = 3.65WFYY157 pKa = 10.86IVKK160 pKa = 10.31SADD163 pKa = 2.9GRR165 pKa = 11.84YY166 pKa = 9.89GLLPRR171 pKa = 11.84ICDD174 pKa = 3.37EE175 pKa = 3.83THH177 pKa = 6.77RR178 pKa = 11.84NSTHH182 pKa = 6.16LPKK185 pKa = 10.49NVHH188 pKa = 6.34LEE190 pKa = 4.16HH191 pKa = 7.11NGDD194 pKa = 3.81RR195 pKa = 11.84VCLIEE200 pKa = 4.08TSYY203 pKa = 8.1TTHH206 pKa = 5.95SCIPKK211 pKa = 9.67LYY213 pKa = 10.64NSIFTLLQLYY223 pKa = 8.36DD224 pKa = 4.01FPIEE228 pKa = 3.84FDD230 pKa = 3.83GVPFSQGSFSLTNNKK245 pKa = 9.52VIGADD250 pKa = 3.51SYY252 pKa = 10.26ITNSVGKK259 pKa = 8.29TPIVVDD265 pKa = 3.93KK266 pKa = 11.6VGGSYY271 pKa = 10.0MLTYY275 pKa = 10.78EE276 pKa = 4.73SFDD279 pKa = 4.02SNQPFYY285 pKa = 10.58IVRR288 pKa = 11.84NQRR291 pKa = 11.84HH292 pKa = 6.16LPTEE296 pKa = 3.64NHH298 pKa = 5.05QCFNLLSHH306 pKa = 6.63YY307 pKa = 10.51SSPLTSIFHH316 pKa = 6.87HH317 pKa = 6.67ISTFIRR323 pKa = 11.84KK324 pKa = 8.09EE325 pKa = 3.49LSYY328 pKa = 10.99LVEE331 pKa = 4.23FLKK334 pKa = 10.94QLAGEE339 pKa = 4.0IALILFKK346 pKa = 10.5IVSEE350 pKa = 3.97LFEE353 pKa = 5.08IFMSLIPYY361 pKa = 9.85NSEE364 pKa = 4.02FYY366 pKa = 10.49TSLFVMTLTYY376 pKa = 10.69FNTRR380 pKa = 11.84DD381 pKa = 3.36IPISCVVFVGVYY393 pKa = 8.4VFKK396 pKa = 10.57IYY398 pKa = 7.6MTSFII403 pKa = 4.78
Molecular weight: 46.56 kDa
Isoelectric point according different methods:
Protein with the highest isoelectric point:
>tr|A0A1W5S133|A0A1W5S133_9VIRU Non-structural protein 3 OS=Castlerea virus OX=1969351 PE=4 SV=1
MM1 pKa = 7.72SSRR4 pKa = 11.84PQKK7 pKa = 10.15RR8 pKa = 11.84SPGKK12 pKa = 7.74TVAAARR18 pKa = 11.84TITPKK23 pKa = 10.37KK24 pKa = 9.44RR25 pKa = 11.84AAPTAPKK32 pKa = 10.14NSRR35 pKa = 11.84RR36 pKa = 11.84PKK38 pKa = 9.82QNLGFDD44 pKa = 4.41LNAVVSDD51 pKa = 3.32ITTTFTKK58 pKa = 10.55GLNRR62 pKa = 11.84PLVLLSVVCVCALVVTHH79 pKa = 6.95SSDD82 pKa = 3.31FTSGVVGKK90 pKa = 9.2WISEE94 pKa = 4.05KK95 pKa = 10.98SSTNSAALWVHH106 pKa = 5.45QNQARR111 pKa = 11.84FLGLAIFLPAILDD124 pKa = 3.85TPDD127 pKa = 3.24SVRR130 pKa = 11.84VAVSLASVFWVMLIPAASIYY150 pKa = 10.41EE151 pKa = 3.99YY152 pKa = 10.67VIQAFALHH160 pKa = 6.5TYY162 pKa = 10.23FRR164 pKa = 11.84VQLQNSRR171 pKa = 11.84ILILLTVGVLYY182 pKa = 10.35FLGHH186 pKa = 6.0ITLSQTSPLTAPAVNGSATNN206 pKa = 3.54
MM1 pKa = 7.72SSRR4 pKa = 11.84PQKK7 pKa = 10.15RR8 pKa = 11.84SPGKK12 pKa = 7.74TVAAARR18 pKa = 11.84TITPKK23 pKa = 10.37KK24 pKa = 9.44RR25 pKa = 11.84AAPTAPKK32 pKa = 10.14NSRR35 pKa = 11.84RR36 pKa = 11.84PKK38 pKa = 9.82QNLGFDD44 pKa = 4.41LNAVVSDD51 pKa = 3.32ITTTFTKK58 pKa = 10.55GLNRR62 pKa = 11.84PLVLLSVVCVCALVVTHH79 pKa = 6.95SSDD82 pKa = 3.31FTSGVVGKK90 pKa = 9.2WISEE94 pKa = 4.05KK95 pKa = 10.98SSTNSAALWVHH106 pKa = 5.45QNQARR111 pKa = 11.84FLGLAIFLPAILDD124 pKa = 3.85TPDD127 pKa = 3.24SVRR130 pKa = 11.84VAVSLASVFWVMLIPAASIYY150 pKa = 10.41EE151 pKa = 3.99YY152 pKa = 10.67VIQAFALHH160 pKa = 6.5TYY162 pKa = 10.23FRR164 pKa = 11.84VQLQNSRR171 pKa = 11.84ILILLTVGVLYY182 pKa = 10.35FLGHH186 pKa = 6.0ITLSQTSPLTAPAVNGSATNN206 pKa = 3.54
Molecular weight: 22.25 kDa
Isoelectric point according different methods:
Peptides (in silico digests for buttom-up proteomics)
Below you can find in silico digests of the whole proteome with Trypsin, Chymotrypsin, Trypsin+LysC, LysN, ArgC proteases suitable for different mass spec machines.| Try ESI |
 |
|---|
| ChTry ESI |
 |
|---|
| ArgC ESI |
 |
|---|
| LysN ESI |
 |
|---|
| TryLysC ESI |
 |
|---|
| Try MALDI |
 |
|---|
| ChTry MALDI |
 |
|---|
| ArgC MALDI |
 |
|---|
| LysN MALDI |
 |
|---|
| TryLysC MALDI |
 |
|---|
| Try LTQ |
 |
|---|
| ChTry LTQ |
 |
|---|
| ArgC LTQ |
 |
|---|
| LysN LTQ |
 |
|---|
| TryLysC LTQ |
 |
|---|
| Try MSlow |
 |
|---|
| ChTry MSlow |
 |
|---|
| ArgC MSlow |
 |
|---|
| LysN MSlow |
 |
|---|
| TryLysC MSlow |
 |
|---|
| Try MShigh |
 |
|---|
| ChTry MShigh |
 |
|---|
| ArgC MShigh |
 |
|---|
| LysN MShigh |
 |
|---|
| TryLysC MShigh |
 |
|---|
General Statistics
Number of major isoforms |
Number of additional isoforms |
Number of all proteins |
Number of amino acids |
Min. Seq. Length |
Max. Seq. Length |
Avg. Seq. Length |
Avg. Mol. Weight |
|---|---|---|---|---|---|---|---|
0 |
2978 |
206 |
2369 |
992.7 |
112.49 |
Amino acid frequency
Ala |
Cys |
Asp |
Glu |
Phe |
Gly |
His |
Ile |
Lys |
Leu |
|---|---|---|---|---|---|---|---|---|---|
5.709 ± 1.476 | 2.317 ± 0.383 |
5.003 ± 1.031 | 5.641 ± 1.35 |
6.212 ± 1.095 | 4.433 ± 0.349 |
2.619 ± 0.377 | 5.809 ± 0.385 |
5.507 ± 0.561 | 9.302 ± 0.819 |
Met |
Asn |
Gln |
Pro |
Arg |
Ser |
Thr |
Val |
Trp |
Tyr |
|---|---|---|---|---|---|---|---|---|---|
2.116 ± 0.513 | 5.44 ± 0.33 |
4.735 ± 0.53 | 3.156 ± 0.209 |
5.339 ± 0.756 | 7.992 ± 0.917 |
6.582 ± 0.583 | 7.858 ± 0.737 |
0.504 ± 0.263 | 3.727 ± 0.594 |
Most of the basic statistics you can see at this page can be downloaded from this CSV file
Proteome-pI is available under Creative Commons Attribution-NoDerivs license, for more details see here
| Reference: Kozlowski LP. Proteome-pI 2.0: Proteome Isoelectric Point Database Update. Nucleic Acids Res. 2021, doi: 10.1093/nar/gkab944 | Contact: Lukasz P. Kozlowski |
