Calothrix sp. PCC 6303
Taxonomy: cellular organisms; Bacteria; Terrabacteria group; Cyanobacteria/Melainabacteria group; Cyanobacteria; Nostocales; Calotrichaceae; Calothrix; unclassified Calothrix
Average proteome isoelectric point is 6.41
Get precalculated fractions of proteins
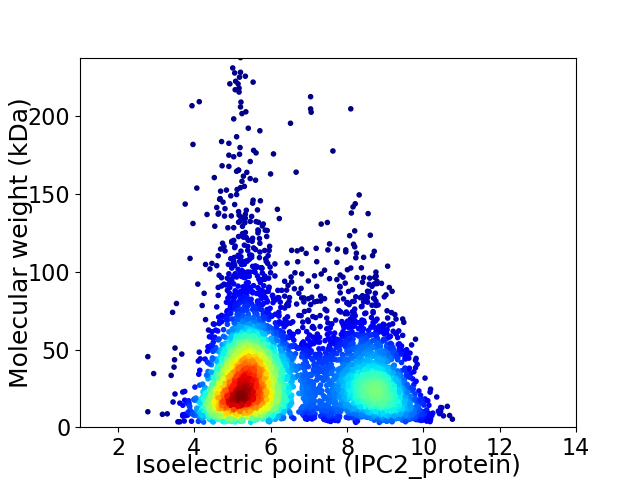
Virtual 2D-PAGE plot for 5484 proteins (isoelectric point calculated using IPC2_protein)
Get csv file with sequences according to given criteria:
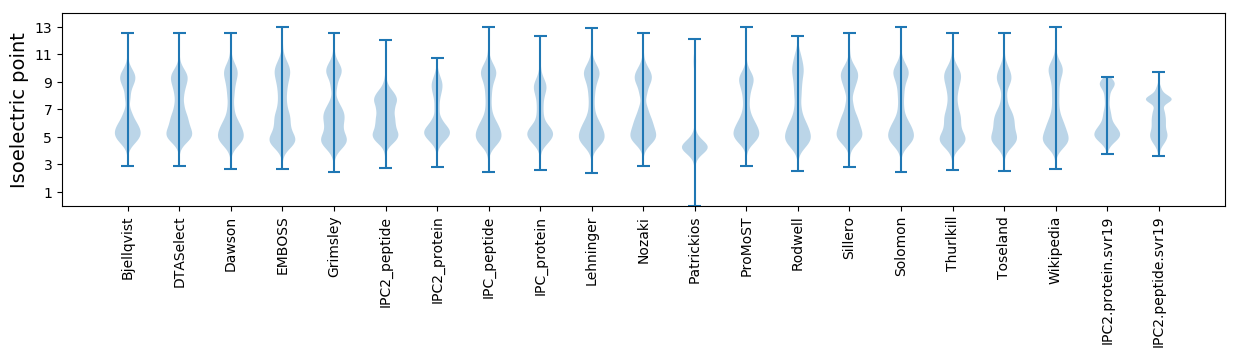
* You can choose from 21 different methods for calculating isoelectric point
Summary statistics related to proteome-wise predictions
Protein with the lowest isoelectric point:
>tr|K9V627|K9V627_9CYAN Uncharacterized protein OS=Calothrix sp. PCC 6303 OX=1170562 GN=Cal6303_4250 PE=4 SV=1
MM1 pKa = 8.06SLEE4 pKa = 4.09QVNAFYY10 pKa = 11.03DD11 pKa = 3.91VLSSDD16 pKa = 3.25QVIYY20 pKa = 10.87DD21 pKa = 3.97EE22 pKa = 4.82YY23 pKa = 11.47CNKK26 pKa = 10.12CCLRR30 pKa = 11.84GLFGIWNWDD39 pKa = 2.96KK40 pKa = 11.79AKK42 pKa = 10.53IVDD45 pKa = 4.96FAASLGFIFTTDD57 pKa = 3.77DD58 pKa = 3.48LNMVLFEE65 pKa = 4.44GDD67 pKa = 3.27AGVVQPSMSVSVNN80 pKa = 3.07
MM1 pKa = 8.06SLEE4 pKa = 4.09QVNAFYY10 pKa = 11.03DD11 pKa = 3.91VLSSDD16 pKa = 3.25QVIYY20 pKa = 10.87DD21 pKa = 3.97EE22 pKa = 4.82YY23 pKa = 11.47CNKK26 pKa = 10.12CCLRR30 pKa = 11.84GLFGIWNWDD39 pKa = 2.96KK40 pKa = 11.79AKK42 pKa = 10.53IVDD45 pKa = 4.96FAASLGFIFTTDD57 pKa = 3.77DD58 pKa = 3.48LNMVLFEE65 pKa = 4.44GDD67 pKa = 3.27AGVVQPSMSVSVNN80 pKa = 3.07
Molecular weight: 8.96 kDa
Isoelectric point according different methods:
Protein with the highest isoelectric point:
>tr|K9V5C6|K9V5C6_9CYAN Uncharacterized protein OS=Calothrix sp. PCC 6303 OX=1170562 GN=Cal6303_4392 PE=3 SV=1
MM1 pKa = 7.08QRR3 pKa = 11.84TLGGTCRR10 pKa = 11.84KK11 pKa = 9.61RR12 pKa = 11.84KK13 pKa = 7.61RR14 pKa = 11.84TSGFRR19 pKa = 11.84ARR21 pKa = 11.84MRR23 pKa = 11.84TPDD26 pKa = 3.17GRR28 pKa = 11.84NVIRR32 pKa = 11.84ARR34 pKa = 11.84RR35 pKa = 11.84SKK37 pKa = 10.3GRR39 pKa = 11.84HH40 pKa = 4.82RR41 pKa = 11.84LSVV44 pKa = 3.12
MM1 pKa = 7.08QRR3 pKa = 11.84TLGGTCRR10 pKa = 11.84KK11 pKa = 9.61RR12 pKa = 11.84KK13 pKa = 7.61RR14 pKa = 11.84TSGFRR19 pKa = 11.84ARR21 pKa = 11.84MRR23 pKa = 11.84TPDD26 pKa = 3.17GRR28 pKa = 11.84NVIRR32 pKa = 11.84ARR34 pKa = 11.84RR35 pKa = 11.84SKK37 pKa = 10.3GRR39 pKa = 11.84HH40 pKa = 4.82RR41 pKa = 11.84LSVV44 pKa = 3.12
Molecular weight: 5.17 kDa
Isoelectric point according different methods:
Peptides (in silico digests for buttom-up proteomics)
Below you can find in silico digests of the whole proteome with Trypsin, Chymotrypsin, Trypsin+LysC, LysN, ArgC proteases suitable for different mass spec machines.| Try ESI |
 |
|---|
| ChTry ESI |
|
|---|
| ArgC ESI |
|
|---|
| LysN ESI |
|
|---|
| TryLysC ESI |
|
|---|
| Try MALDI |
|
|---|
| ChTry MALDI |
|
|---|
| ArgC MALDI |
|
|---|
| LysN MALDI |
|
|---|
| TryLysC MALDI |
|
|---|
| Try LTQ |
|
|---|
| ChTry LTQ |
|
|---|
| ArgC LTQ |
|
|---|
| LysN LTQ |
|
|---|
| TryLysC LTQ |
|
|---|
| Try MSlow |
|
|---|
| ChTry MSlow |
|
|---|
| ArgC MSlow |
|
|---|
| LysN MSlow |
|
|---|
| TryLysC MSlow |
|
|---|
| Try MShigh |
|
|---|
| ChTry MShigh |
|
|---|
| ArgC MShigh |
|
|---|
| LysN MShigh |
|
|---|
| TryLysC MShigh |
|
|---|
General Statistics
Number of major isoforms |
Number of additional isoforms |
Number of all proteins |
Number of amino acids |
Min. Seq. Length |
Max. Seq. Length |
Avg. Seq. Length |
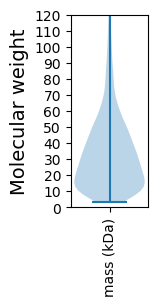
Avg. Mol. Weight |
|---|---|---|---|---|---|---|---|
0 |
1811230 |
28 |
2083 |
330.3 |
36.86 |
Amino acid frequency
Ala |
Cys |
Asp |
Glu |
Phe |
Gly |
His |
Ile |
Lys |
Leu |
|---|---|---|---|---|---|---|---|---|---|
7.64 ± 0.03 | 0.994 ± 0.011 |
4.916 ± 0.022 | 6.256 ± 0.037 |
4.004 ± 0.02 | 6.59 ± 0.039 |
1.746 ± 0.016 | 7.219 ± 0.032 |
5.362 ± 0.034 | 10.651 ± 0.045 |
Met |
Asn |
Gln |
Pro |
Arg |
Ser |
Thr |
Val |
Trp |
Tyr |
|---|---|---|---|---|---|---|---|---|---|
1.869 ± 0.014 | 4.923 ± 0.029 |
4.43 ± 0.025 | 5.305 ± 0.031 |
4.81 ± 0.027 | 6.747 ± 0.027 |
5.705 ± 0.028 | 6.414 ± 0.028 |
1.365 ± 0.015 | 3.054 ± 0.022 |
Most of the basic statistics you can see at this page can be downloaded from this CSV file
See this proteome in:

Proteome-pI is available under Creative Commons Attribution-NoDerivs license, for more details see here
| Reference: Kozlowski LP. Proteome-pI 2.0: Proteome Isoelectric Point Database Update. Nucleic Acids Res. 2021, doi: 10.1093/nar/gkab944 | Contact: Lukasz P. Kozlowski |