Laccaria amethystina LaAM-08-1
Taxonomy: cellular organisms; Eukaryota; Opisthokonta; Fungi; Dikarya; Basidiomycota; Agaricomycotina; Agaricomycetes; Agaricomycetidae; Agaricales; Tricholomataceae; Laccaria; Laccaria amethystina
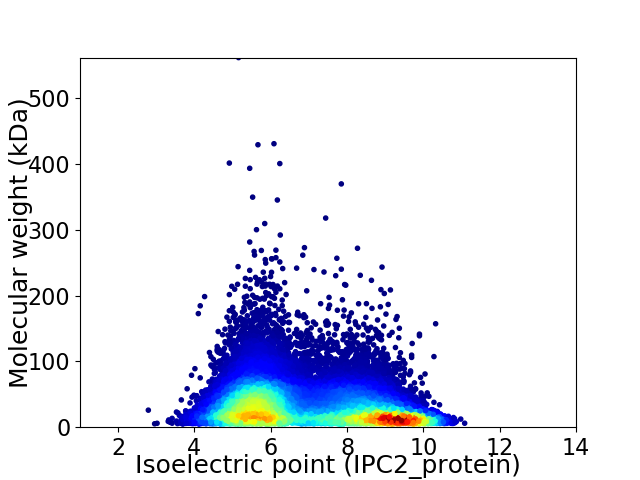
Average proteome isoelectric point is 6.99
Get precalculated fractions of proteins

Virtual 2D-PAGE plot for 20893 proteins (isoelectric point calculated using IPC2_protein)
Get csv file with sequences according to given criteria:
* You can choose from 21 different methods for calculating isoelectric point
Summary statistics related to proteome-wise predictions


Protein with the lowest isoelectric point:
>tr|A0A0C9YDX5|A0A0C9YDX5_9AGAR Dipeptidyl peptidase 3 OS=Laccaria amethystina LaAM-08-1 OX=1095629 GN=K443DRAFT_672163 PE=3 SV=1
MM1 pKa = 7.65SSLLSLISLLSLLAAVYY18 pKa = 9.31SAPAQLSYY26 pKa = 11.41DD27 pKa = 3.5QLTPSPAAAPDD38 pKa = 3.79FLKK41 pKa = 11.12QNGLDD46 pKa = 3.62AQKK49 pKa = 10.85LNSQFASMKK58 pKa = 9.34PTDD61 pKa = 3.74SCQDD65 pKa = 3.04GQMACVTSAFAQCVGGKK82 pKa = 8.77WSLSTCSSGLACYY95 pKa = 9.93ALPLVNKK102 pKa = 9.44PGTSLVCDD110 pKa = 3.9TPMDD114 pKa = 3.73AAARR118 pKa = 11.84FAATGVDD125 pKa = 3.41GGVTGTVPPAQGNNSTSAPTPSGVDD150 pKa = 3.39DD151 pKa = 5.28PVDD154 pKa = 4.61DD155 pKa = 5.73DD156 pKa = 5.75CDD158 pKa = 5.0DD159 pKa = 4.44DD160 pKa = 4.66TSSTDD165 pKa = 4.6DD166 pKa = 4.85GDD168 pKa = 5.83GDD170 pKa = 4.31DD171 pKa = 5.05CDD173 pKa = 4.14EE174 pKa = 4.41GTPVAGAPQIPDD186 pKa = 3.68DD187 pKa = 4.34HH188 pKa = 8.39CGDD191 pKa = 5.1DD192 pKa = 4.17DD193 pKa = 4.19TTSSVPLTTPRR204 pKa = 11.84TVKK207 pKa = 10.39SASQSRR213 pKa = 11.84TVTSASSTPTIANQANEE230 pKa = 4.18PAPTTIYY237 pKa = 9.7LTSQSSASTTPSVILLNRR255 pKa = 11.84RR256 pKa = 11.84QAPSTLPTPPPATTTALTSSAPISTSSSSPAIVTPTVVIGTDD298 pKa = 4.22GIVTVTVVSTVFVSASCGLPSVSATLSSAPSAITVSSAIPPAVTLTSPAITSSSASSASITATPSATGVISLSVPPVASDD378 pKa = 3.06TSINGSAGGGLTFISQVATPPAVPSPTGSFNLSEE412 pKa = 4.67LLTATVASS420 pKa = 4.16
MM1 pKa = 7.65SSLLSLISLLSLLAAVYY18 pKa = 9.31SAPAQLSYY26 pKa = 11.41DD27 pKa = 3.5QLTPSPAAAPDD38 pKa = 3.79FLKK41 pKa = 11.12QNGLDD46 pKa = 3.62AQKK49 pKa = 10.85LNSQFASMKK58 pKa = 9.34PTDD61 pKa = 3.74SCQDD65 pKa = 3.04GQMACVTSAFAQCVGGKK82 pKa = 8.77WSLSTCSSGLACYY95 pKa = 9.93ALPLVNKK102 pKa = 9.44PGTSLVCDD110 pKa = 3.9TPMDD114 pKa = 3.73AAARR118 pKa = 11.84FAATGVDD125 pKa = 3.41GGVTGTVPPAQGNNSTSAPTPSGVDD150 pKa = 3.39DD151 pKa = 5.28PVDD154 pKa = 4.61DD155 pKa = 5.73DD156 pKa = 5.75CDD158 pKa = 5.0DD159 pKa = 4.44DD160 pKa = 4.66TSSTDD165 pKa = 4.6DD166 pKa = 4.85GDD168 pKa = 5.83GDD170 pKa = 4.31DD171 pKa = 5.05CDD173 pKa = 4.14EE174 pKa = 4.41GTPVAGAPQIPDD186 pKa = 3.68DD187 pKa = 4.34HH188 pKa = 8.39CGDD191 pKa = 5.1DD192 pKa = 4.17DD193 pKa = 4.19TTSSVPLTTPRR204 pKa = 11.84TVKK207 pKa = 10.39SASQSRR213 pKa = 11.84TVTSASSTPTIANQANEE230 pKa = 4.18PAPTTIYY237 pKa = 9.7LTSQSSASTTPSVILLNRR255 pKa = 11.84RR256 pKa = 11.84QAPSTLPTPPPATTTALTSSAPISTSSSSPAIVTPTVVIGTDD298 pKa = 4.22GIVTVTVVSTVFVSASCGLPSVSATLSSAPSAITVSSAIPPAVTLTSPAITSSSASSASITATPSATGVISLSVPPVASDD378 pKa = 3.06TSINGSAGGGLTFISQVATPPAVPSPTGSFNLSEE412 pKa = 4.67LLTATVASS420 pKa = 4.16
Molecular weight: 41.44 kDa
Isoelectric point according different methods:
Protein with the highest isoelectric point:
>tr|A0A0C9WUF4|A0A0C9WUF4_9AGAR Unplaced genomic scaffold K443scaffold_52 whole genome shotgun sequence (Fragment) OS=Laccaria amethystina LaAM-08-1 OX=1095629 GN=K443DRAFT_40104 PE=4 SV=1
MM1 pKa = 7.95RR2 pKa = 11.84LMRR5 pKa = 11.84QNTLQLLIPLPMSIQRR21 pKa = 11.84LNVINPILRR30 pKa = 11.84RR31 pKa = 11.84PGLPLLHH38 pKa = 6.21GRR40 pKa = 11.84LRR42 pKa = 11.84HH43 pKa = 5.5AHH45 pKa = 5.26TLHH48 pKa = 6.41PRR50 pKa = 11.84KK51 pKa = 10.0
MM1 pKa = 7.95RR2 pKa = 11.84LMRR5 pKa = 11.84QNTLQLLIPLPMSIQRR21 pKa = 11.84LNVINPILRR30 pKa = 11.84RR31 pKa = 11.84PGLPLLHH38 pKa = 6.21GRR40 pKa = 11.84LRR42 pKa = 11.84HH43 pKa = 5.5AHH45 pKa = 5.26TLHH48 pKa = 6.41PRR50 pKa = 11.84KK51 pKa = 10.0
Molecular weight: 6.03 kDa
Isoelectric point according different methods:
Peptides (in silico digests for buttom-up proteomics)
Below you can find in silico digests of the whole proteome with Trypsin, Chymotrypsin, Trypsin+LysC, LysN, ArgC proteases suitable for different mass spec machines.| Try ESI |
 |
|---|
| ChTry ESI |
 |
|---|
| ArgC ESI |
 |
|---|
| LysN ESI |
 |
|---|
| TryLysC ESI |
 |
|---|
| Try MALDI |
 |
|---|
| ChTry MALDI |
 |
|---|
| ArgC MALDI |
 |
|---|
| LysN MALDI |
 |
|---|
| TryLysC MALDI |
 |
|---|
| Try LTQ |
 |
|---|
| ChTry LTQ |
 |
|---|
| ArgC LTQ |
 |
|---|
| LysN LTQ |
 |
|---|
| TryLysC LTQ |
 |
|---|
| Try MSlow |
 |
|---|
| ChTry MSlow |
 |
|---|
| ArgC MSlow |
 |
|---|
| LysN MSlow |
 |
|---|
| TryLysC MSlow |
 |
|---|
| Try MShigh |
 |
|---|
| ChTry MShigh |
 |
|---|
| ArgC MShigh |
 |
|---|
| LysN MShigh |
 |
|---|
| TryLysC MShigh |
 |
|---|
General Statistics
Number of major isoforms |
Number of additional isoforms |
Number of all proteins |
Number of amino acids |
Min. Seq. Length |
Max. Seq. Length |
Avg. Seq. Length |
Avg. Mol. Weight |
|---|---|---|---|---|---|---|---|
6674714 |
46 |
5021 |
319.5 |
35.47 |
Amino acid frequency
Ala |
Cys |
Asp |
Glu |
Phe |
Gly |
His |
Ile |
Lys |
Leu |
|---|---|---|---|---|---|---|---|---|---|
7.707 ± 0.016 | 1.421 ± 0.009 |
5.393 ± 0.013 | 5.749 ± 0.02 |
3.882 ± 0.013 | 6.256 ± 0.016 |
2.745 ± 0.009 | 5.055 ± 0.015 |
4.8 ± 0.016 | 9.441 ± 0.024 |
Met |
Asn |
Gln |
Pro |
Arg |
Ser |
Thr |
Val |
Trp |
Tyr |
|---|---|---|---|---|---|---|---|---|---|
2.06 ± 0.007 | 3.696 ± 0.011 |
6.55 ± 0.024 | 3.81 ± 0.012 |
6.127 ± 0.016 | 8.929 ± 0.025 |
6.155 ± 0.013 | 6.188 ± 0.015 |
1.438 ± 0.006 | 2.598 ± 0.01 |
Most of the basic statistics you can see at this page can be downloaded from this CSV file
Proteome-pI is available under Creative Commons Attribution-NoDerivs license, for more details see here
| Reference: Kozlowski LP. Proteome-pI 2.0: Proteome Isoelectric Point Database Update. Nucleic Acids Res. 2021, doi: 10.1093/nar/gkab944 | Contact: Lukasz P. Kozlowski |
