Xiburema virus
Taxonomy: Viruses; Riboviria; Orthornavirae; Negarnaviricota; Haploviricotina; Monjiviricetes; Mononegavirales; Rhabdoviridae; Alpharhabdovirinae; Arurhavirus; Xiburema arurhavirus
Average proteome isoelectric point is 6.64
Get precalculated fractions of proteins

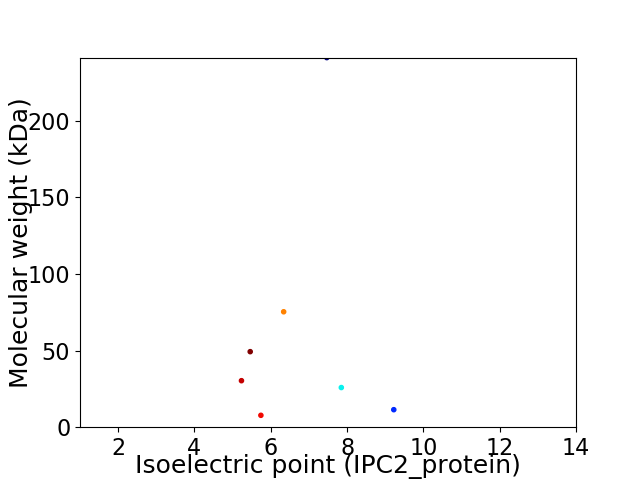
Virtual 2D-PAGE plot for 7 proteins (isoelectric point calculated using IPC2_protein)
Get csv file with sequences according to given criteria:
* You can choose from 21 different methods for calculating isoelectric point
Summary statistics related to proteome-wise predictions


Protein with the lowest isoelectric point:
>tr|A0A059U1X5|A0A059U1X5_9RHAB RNA-directed RNA polymerase L OS=Xiburema virus OX=1272959 PE=3 SV=1
MM1 pKa = 8.0DD2 pKa = 5.37PANLVRR8 pKa = 11.84FGSKK12 pKa = 10.09GRR14 pKa = 11.84FPNMKK19 pKa = 9.99LAIEE23 pKa = 4.47DD24 pKa = 3.57MLMTEE29 pKa = 4.51SALEE33 pKa = 4.19AEE35 pKa = 4.89SNPINNQPAPLLTSFLAEE53 pKa = 3.55VDD55 pKa = 3.96GQNLDD60 pKa = 3.44AAAEE64 pKa = 4.11EE65 pKa = 4.35DD66 pKa = 3.45WGEE69 pKa = 4.08KK70 pKa = 9.01VAQEE74 pKa = 4.25VFQGDD79 pKa = 3.6WDD81 pKa = 4.06MEE83 pKa = 4.66DD84 pKa = 3.6GPKK87 pKa = 9.14FTFLLNYY94 pKa = 9.53LPPDD98 pKa = 3.33LRR100 pKa = 11.84DD101 pKa = 3.44QVEE104 pKa = 4.32SSVLNLLDD112 pKa = 4.26WINTSSRR119 pKa = 11.84VGLYY123 pKa = 8.04MRR125 pKa = 11.84RR126 pKa = 11.84TEE128 pKa = 3.91SSVEE132 pKa = 3.7IKK134 pKa = 10.54YY135 pKa = 8.68EE136 pKa = 4.1KK137 pKa = 9.91PDD139 pKa = 3.65EE140 pKa = 4.65KK141 pKa = 10.83DD142 pKa = 3.14PPLAPVQIPEE152 pKa = 4.31PVPSSSAQKK161 pKa = 10.84LNLNKK166 pKa = 7.78EE167 pKa = 4.62TPVKK171 pKa = 10.56KK172 pKa = 9.88PIKK175 pKa = 9.84LAPTFNEE182 pKa = 4.02EE183 pKa = 3.85RR184 pKa = 11.84CISLGEE190 pKa = 4.27GKK192 pKa = 10.28SGEE195 pKa = 4.16ALYY198 pKa = 11.24LNLKK202 pKa = 9.99HH203 pKa = 6.22GVKK206 pKa = 10.22FPKK209 pKa = 9.55RR210 pKa = 11.84TGSGHH215 pKa = 6.75LKK217 pKa = 10.59VSLEE221 pKa = 4.1TPGIKK226 pKa = 10.38DD227 pKa = 3.63ADD229 pKa = 3.36IEE231 pKa = 4.39KK232 pKa = 10.44YY233 pKa = 10.41KK234 pKa = 10.84NYY236 pKa = 9.3PLKK239 pKa = 10.86EE240 pKa = 4.15GLHH243 pKa = 6.19KK244 pKa = 10.49LLKK247 pKa = 10.36RR248 pKa = 11.84AGIWKK253 pKa = 9.76ALVGVADD260 pKa = 3.82VEE262 pKa = 4.48KK263 pKa = 10.37PIWPDD268 pKa = 2.85LRR270 pKa = 11.84YY271 pKa = 10.2
MM1 pKa = 8.0DD2 pKa = 5.37PANLVRR8 pKa = 11.84FGSKK12 pKa = 10.09GRR14 pKa = 11.84FPNMKK19 pKa = 9.99LAIEE23 pKa = 4.47DD24 pKa = 3.57MLMTEE29 pKa = 4.51SALEE33 pKa = 4.19AEE35 pKa = 4.89SNPINNQPAPLLTSFLAEE53 pKa = 3.55VDD55 pKa = 3.96GQNLDD60 pKa = 3.44AAAEE64 pKa = 4.11EE65 pKa = 4.35DD66 pKa = 3.45WGEE69 pKa = 4.08KK70 pKa = 9.01VAQEE74 pKa = 4.25VFQGDD79 pKa = 3.6WDD81 pKa = 4.06MEE83 pKa = 4.66DD84 pKa = 3.6GPKK87 pKa = 9.14FTFLLNYY94 pKa = 9.53LPPDD98 pKa = 3.33LRR100 pKa = 11.84DD101 pKa = 3.44QVEE104 pKa = 4.32SSVLNLLDD112 pKa = 4.26WINTSSRR119 pKa = 11.84VGLYY123 pKa = 8.04MRR125 pKa = 11.84RR126 pKa = 11.84TEE128 pKa = 3.91SSVEE132 pKa = 3.7IKK134 pKa = 10.54YY135 pKa = 8.68EE136 pKa = 4.1KK137 pKa = 9.91PDD139 pKa = 3.65EE140 pKa = 4.65KK141 pKa = 10.83DD142 pKa = 3.14PPLAPVQIPEE152 pKa = 4.31PVPSSSAQKK161 pKa = 10.84LNLNKK166 pKa = 7.78EE167 pKa = 4.62TPVKK171 pKa = 10.56KK172 pKa = 9.88PIKK175 pKa = 9.84LAPTFNEE182 pKa = 4.02EE183 pKa = 3.85RR184 pKa = 11.84CISLGEE190 pKa = 4.27GKK192 pKa = 10.28SGEE195 pKa = 4.16ALYY198 pKa = 11.24LNLKK202 pKa = 9.99HH203 pKa = 6.22GVKK206 pKa = 10.22FPKK209 pKa = 9.55RR210 pKa = 11.84TGSGHH215 pKa = 6.75LKK217 pKa = 10.59VSLEE221 pKa = 4.1TPGIKK226 pKa = 10.38DD227 pKa = 3.63ADD229 pKa = 3.36IEE231 pKa = 4.39KK232 pKa = 10.44YY233 pKa = 10.41KK234 pKa = 10.84NYY236 pKa = 9.3PLKK239 pKa = 10.86EE240 pKa = 4.15GLHH243 pKa = 6.19KK244 pKa = 10.49LLKK247 pKa = 10.36RR248 pKa = 11.84AGIWKK253 pKa = 9.76ALVGVADD260 pKa = 3.82VEE262 pKa = 4.48KK263 pKa = 10.37PIWPDD268 pKa = 2.85LRR270 pKa = 11.84YY271 pKa = 10.2
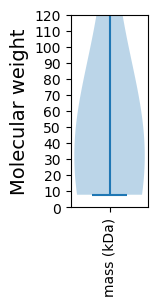
Molecular weight: 30.34 kDa
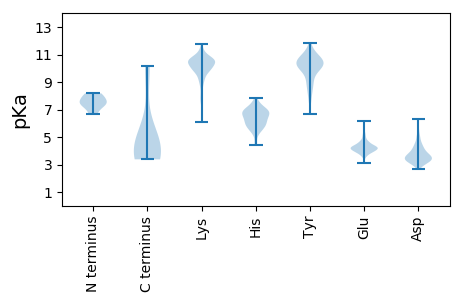
Isoelectric point according different methods:
Protein with the highest isoelectric point:
>tr|A0A059TZZ5|A0A059TZZ5_9RHAB Nucleocapsid protein OS=Xiburema virus OX=1272959 PE=4 SV=1
MM1 pKa = 7.32EE2 pKa = 5.83RR3 pKa = 11.84GIGFNPSQAIDD14 pKa = 4.42GIKK17 pKa = 10.46GALNNLGNSISSFFNDD33 pKa = 3.25IGIKK37 pKa = 9.97LNYY40 pKa = 7.81WGKK43 pKa = 10.11IFLIIIGVILGLIIIPRR60 pKa = 11.84LISNVCTIISGLSKK74 pKa = 10.4CLRR77 pKa = 11.84WLWRR81 pKa = 11.84MVSACRR87 pKa = 11.84LRR89 pKa = 11.84CPRR92 pKa = 11.84LCCKK96 pKa = 10.07FRR98 pKa = 11.84RR99 pKa = 11.84GDD101 pKa = 3.27NN102 pKa = 3.38
MM1 pKa = 7.32EE2 pKa = 5.83RR3 pKa = 11.84GIGFNPSQAIDD14 pKa = 4.42GIKK17 pKa = 10.46GALNNLGNSISSFFNDD33 pKa = 3.25IGIKK37 pKa = 9.97LNYY40 pKa = 7.81WGKK43 pKa = 10.11IFLIIIGVILGLIIIPRR60 pKa = 11.84LISNVCTIISGLSKK74 pKa = 10.4CLRR77 pKa = 11.84WLWRR81 pKa = 11.84MVSACRR87 pKa = 11.84LRR89 pKa = 11.84CPRR92 pKa = 11.84LCCKK96 pKa = 10.07FRR98 pKa = 11.84RR99 pKa = 11.84GDD101 pKa = 3.27NN102 pKa = 3.38
Molecular weight: 11.43 kDa
Isoelectric point according different methods:
Peptides (in silico digests for buttom-up proteomics)
Below you can find in silico digests of the whole proteome with Trypsin, Chymotrypsin, Trypsin+LysC, LysN, ArgC proteases suitable for different mass spec machines.| Try ESI |
 |
|---|
| ChTry ESI |
 |
|---|
| ArgC ESI |
 |
|---|
| LysN ESI |
 |
|---|
| TryLysC ESI |
 |
|---|
| Try MALDI |
 |
|---|
| ChTry MALDI |
 |
|---|
| ArgC MALDI |
 |
|---|
| LysN MALDI |
 |
|---|
| TryLysC MALDI |
 |
|---|
| Try LTQ |
 |
|---|
| ChTry LTQ |
 |
|---|
| ArgC LTQ |
 |
|---|
| LysN LTQ |
 |
|---|
| TryLysC LTQ |
 |
|---|
| Try MSlow |
 |
|---|
| ChTry MSlow |
 |
|---|
| ArgC MSlow |
 |
|---|
| LysN MSlow |
 |
|---|
| TryLysC MSlow |
 |
|---|
| Try MShigh |
 |
|---|
| ChTry MShigh |
 |
|---|
| ArgC MShigh |
 |
|---|
| LysN MShigh |
 |
|---|
| TryLysC MShigh |
 |
|---|
General Statistics
Number of major isoforms |
Number of additional isoforms |
Number of all proteins |
Number of amino acids |
Min. Seq. Length |
Max. Seq. Length |
Avg. Seq. Length |
Avg. Mol. Weight |
|---|---|---|---|---|---|---|---|
0 |
3865 |
65 |
2100 |
552.1 |
63.01 |
Amino acid frequency
Ala |
Cys |
Asp |
Glu |
Phe |
Gly |
His |
Ile |
Lys |
Leu |
|---|---|---|---|---|---|---|---|---|---|
4.088 ± 0.515 | 1.785 ± 0.309 |
5.201 ± 0.398 | 6.442 ± 0.639 |
3.752 ± 0.359 | 6.261 ± 0.236 |
2.251 ± 0.396 | 7.995 ± 0.677 |
6.779 ± 0.307 | 9.832 ± 0.698 |
Met |
Asn |
Gln |
Pro |
Arg |
Ser |
Thr |
Val |
Trp |
Tyr |
|---|---|---|---|---|---|---|---|---|---|
3.389 ± 0.347 | 5.408 ± 0.351 |
5.123 ± 0.752 | 3.596 ± 0.295 |
5.045 ± 0.308 | 7.4 ± 0.601 |
5.252 ± 0.397 | 5.019 ± 0.63 |
1.785 ± 0.183 | 3.596 ± 0.532 |
Most of the basic statistics you can see at this page can be downloaded from this CSV file
Proteome-pI is available under Creative Commons Attribution-NoDerivs license, for more details see here
| Reference: Kozlowski LP. Proteome-pI 2.0: Proteome Isoelectric Point Database Update. Nucleic Acids Res. 2021, doi: 10.1093/nar/gkab944 | Contact: Lukasz P. Kozlowski |
