Rhinolophus simulator polyomavirus 2
Taxonomy: Viruses; Monodnaviria; Shotokuvirae; Cossaviricota; Papovaviricetes; Sepolyvirales; Polyomaviridae; unclassified Polyomaviridae
Average proteome isoelectric point is 6.11
Get precalculated fractions of proteins

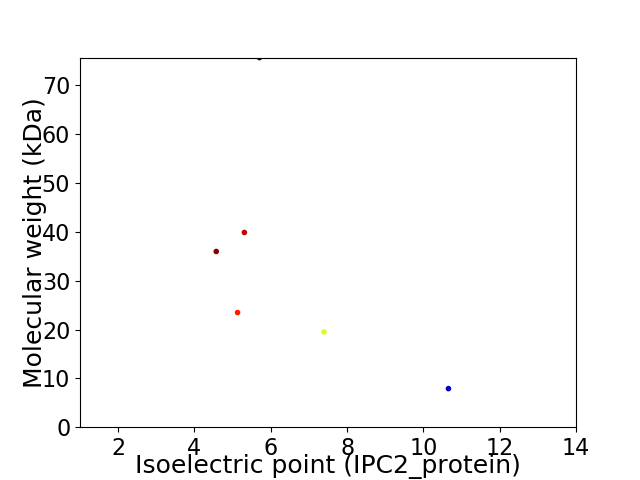
Virtual 2D-PAGE plot for 6 proteins (isoelectric point calculated using IPC2_protein)
Get csv file with sequences according to given criteria:
* You can choose from 21 different methods for calculating isoelectric point
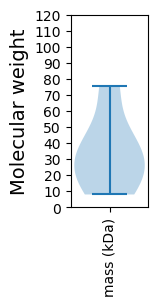
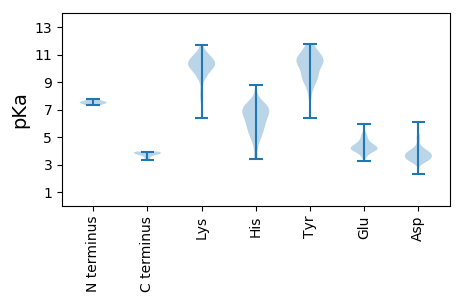
Summary statistics related to proteome-wise predictions


Protein with the lowest isoelectric point:
>tr|A0A223Z965|A0A223Z965_9POLY Minor capsid protein VP2 OS=Rhinolophus simulator polyomavirus 2 OX=2029305 GN=VP3 PE=3 SV=1
MM1 pKa = 7.32GAFLAVLAEE10 pKa = 4.05VFEE13 pKa = 4.78LSSITGLSVEE23 pKa = 4.49TFLSGEE29 pKa = 4.08AFATAEE35 pKa = 4.36LLEE38 pKa = 4.25SHH40 pKa = 7.02ISNLVVYY47 pKa = 10.33GGLTEE52 pKa = 4.68AEE54 pKa = 4.46AIAATEE60 pKa = 4.21ISAEE64 pKa = 4.19AYY66 pKa = 9.42SALTSLEE73 pKa = 3.87ATFPQAFTALATTEE87 pKa = 4.06LATTGTLTVGAAIAAALYY105 pKa = 9.09PYY107 pKa = 10.4YY108 pKa = 10.6YY109 pKa = 10.43DD110 pKa = 4.18LSVPIANLDD119 pKa = 3.27RR120 pKa = 11.84TMALQIYY127 pKa = 9.19FPDD130 pKa = 3.68YY131 pKa = 11.2DD132 pKa = 3.35IDD134 pKa = 4.28FPGVRR139 pKa = 11.84ALARR143 pKa = 11.84FLNYY147 pKa = 9.32IDD149 pKa = 5.06PYY151 pKa = 9.41TWASDD156 pKa = 3.75LYY158 pKa = 10.72HH159 pKa = 7.04SIGRR163 pKa = 11.84HH164 pKa = 3.4FWEE167 pKa = 4.23RR168 pKa = 11.84VQRR171 pKa = 11.84YY172 pKa = 6.37GQNVLQQQLEE182 pKa = 4.24QQTRR186 pKa = 11.84ALAARR191 pKa = 11.84GVQSVSEE198 pKa = 4.61LIAQYY203 pKa = 10.61FEE205 pKa = 3.75NARR208 pKa = 11.84WAITSGPQTFYY219 pKa = 11.64NSLQAYY225 pKa = 8.49YY226 pKa = 10.81SEE228 pKa = 4.89LPGVNPIQARR238 pKa = 11.84DD239 pKa = 3.32LYY241 pKa = 10.98RR242 pKa = 11.84RR243 pKa = 11.84LGEE246 pKa = 4.32NMPQRR251 pKa = 11.84YY252 pKa = 9.01GISADD257 pKa = 4.12AIADD261 pKa = 3.79QQSAEE266 pKa = 4.18YY267 pKa = 9.42VHH269 pKa = 7.2RR270 pKa = 11.84EE271 pKa = 4.05GPPGGAEE278 pKa = 4.22QRR280 pKa = 11.84TTPDD284 pKa = 2.28WMLPLILGLYY294 pKa = 10.49GEE296 pKa = 5.2LTPSWSHH303 pKa = 4.87TLEE306 pKa = 4.07EE307 pKa = 4.79LEE309 pKa = 4.68EE310 pKa = 4.49EE311 pKa = 4.01EE312 pKa = 5.96DD313 pKa = 4.05GPKK316 pKa = 10.04KK317 pKa = 10.41KK318 pKa = 10.27KK319 pKa = 10.08LRR321 pKa = 11.84RR322 pKa = 11.84DD323 pKa = 3.25TT324 pKa = 3.8
MM1 pKa = 7.32GAFLAVLAEE10 pKa = 4.05VFEE13 pKa = 4.78LSSITGLSVEE23 pKa = 4.49TFLSGEE29 pKa = 4.08AFATAEE35 pKa = 4.36LLEE38 pKa = 4.25SHH40 pKa = 7.02ISNLVVYY47 pKa = 10.33GGLTEE52 pKa = 4.68AEE54 pKa = 4.46AIAATEE60 pKa = 4.21ISAEE64 pKa = 4.19AYY66 pKa = 9.42SALTSLEE73 pKa = 3.87ATFPQAFTALATTEE87 pKa = 4.06LATTGTLTVGAAIAAALYY105 pKa = 9.09PYY107 pKa = 10.4YY108 pKa = 10.6YY109 pKa = 10.43DD110 pKa = 4.18LSVPIANLDD119 pKa = 3.27RR120 pKa = 11.84TMALQIYY127 pKa = 9.19FPDD130 pKa = 3.68YY131 pKa = 11.2DD132 pKa = 3.35IDD134 pKa = 4.28FPGVRR139 pKa = 11.84ALARR143 pKa = 11.84FLNYY147 pKa = 9.32IDD149 pKa = 5.06PYY151 pKa = 9.41TWASDD156 pKa = 3.75LYY158 pKa = 10.72HH159 pKa = 7.04SIGRR163 pKa = 11.84HH164 pKa = 3.4FWEE167 pKa = 4.23RR168 pKa = 11.84VQRR171 pKa = 11.84YY172 pKa = 6.37GQNVLQQQLEE182 pKa = 4.24QQTRR186 pKa = 11.84ALAARR191 pKa = 11.84GVQSVSEE198 pKa = 4.61LIAQYY203 pKa = 10.61FEE205 pKa = 3.75NARR208 pKa = 11.84WAITSGPQTFYY219 pKa = 11.64NSLQAYY225 pKa = 8.49YY226 pKa = 10.81SEE228 pKa = 4.89LPGVNPIQARR238 pKa = 11.84DD239 pKa = 3.32LYY241 pKa = 10.98RR242 pKa = 11.84RR243 pKa = 11.84LGEE246 pKa = 4.32NMPQRR251 pKa = 11.84YY252 pKa = 9.01GISADD257 pKa = 4.12AIADD261 pKa = 3.79QQSAEE266 pKa = 4.18YY267 pKa = 9.42VHH269 pKa = 7.2RR270 pKa = 11.84EE271 pKa = 4.05GPPGGAEE278 pKa = 4.22QRR280 pKa = 11.84TTPDD284 pKa = 2.28WMLPLILGLYY294 pKa = 10.49GEE296 pKa = 5.2LTPSWSHH303 pKa = 4.87TLEE306 pKa = 4.07EE307 pKa = 4.79LEE309 pKa = 4.68EE310 pKa = 4.49EE311 pKa = 4.01EE312 pKa = 5.96DD313 pKa = 4.05GPKK316 pKa = 10.04KK317 pKa = 10.41KK318 pKa = 10.27KK319 pKa = 10.08LRR321 pKa = 11.84RR322 pKa = 11.84DD323 pKa = 3.25TT324 pKa = 3.8
Molecular weight: 35.99 kDa
Isoelectric point according different methods:
Protein with the highest isoelectric point:
>tr|A0A223Z924|A0A223Z924_9POLY Minor capsid protein OS=Rhinolophus simulator polyomavirus 2 OX=2029305 GN=VP2 PE=3 SV=1
MM1 pKa = 7.42AHH3 pKa = 7.34LSGKK7 pKa = 10.33SGGKK11 pKa = 9.37NLIQSLIYY19 pKa = 10.21FVMKK23 pKa = 10.58QSLKK27 pKa = 10.22MILRR31 pKa = 11.84PLTKK35 pKa = 9.63EE36 pKa = 3.59RR37 pKa = 11.84QRR39 pKa = 11.84MKK41 pKa = 9.59THH43 pKa = 5.64HH44 pKa = 5.88QGPRR48 pKa = 11.84LLHH51 pKa = 5.96LRR53 pKa = 11.84RR54 pKa = 11.84KK55 pKa = 10.04KK56 pKa = 10.6KK57 pKa = 9.38ILPRR61 pKa = 11.84GTYY64 pKa = 10.5LKK66 pKa = 10.38II67 pKa = 3.83
MM1 pKa = 7.42AHH3 pKa = 7.34LSGKK7 pKa = 10.33SGGKK11 pKa = 9.37NLIQSLIYY19 pKa = 10.21FVMKK23 pKa = 10.58QSLKK27 pKa = 10.22MILRR31 pKa = 11.84PLTKK35 pKa = 9.63EE36 pKa = 3.59RR37 pKa = 11.84QRR39 pKa = 11.84MKK41 pKa = 9.59THH43 pKa = 5.64HH44 pKa = 5.88QGPRR48 pKa = 11.84LLHH51 pKa = 5.96LRR53 pKa = 11.84RR54 pKa = 11.84KK55 pKa = 10.04KK56 pKa = 10.6KK57 pKa = 9.38ILPRR61 pKa = 11.84GTYY64 pKa = 10.5LKK66 pKa = 10.38II67 pKa = 3.83
Molecular weight: 7.9 kDa
Isoelectric point according different methods:
Peptides (in silico digests for buttom-up proteomics)
Below you can find in silico digests of the whole proteome with Trypsin, Chymotrypsin, Trypsin+LysC, LysN, ArgC proteases suitable for different mass spec machines.| Try ESI |
 |
|---|
| ChTry ESI |
 |
|---|
| ArgC ESI |
 |
|---|
| LysN ESI |
 |
|---|
| TryLysC ESI |
 |
|---|
| Try MALDI |
 |
|---|
| ChTry MALDI |
 |
|---|
| ArgC MALDI |
 |
|---|
| LysN MALDI |
 |
|---|
| TryLysC MALDI |
 |
|---|
| Try LTQ |
 |
|---|
| ChTry LTQ |
 |
|---|
| ArgC LTQ |
 |
|---|
| LysN LTQ |
 |
|---|
| TryLysC LTQ |
 |
|---|
| Try MSlow |
 |
|---|
| ChTry MSlow |
 |
|---|
| ArgC MSlow |
 |
|---|
| LysN MSlow |
 |
|---|
| TryLysC MSlow |
 |
|---|
| Try MShigh |
 |
|---|
| ChTry MShigh |
 |
|---|
| ArgC MShigh |
 |
|---|
| LysN MShigh |
 |
|---|
| TryLysC MShigh |
 |
|---|
General Statistics
Number of major isoforms |
Number of additional isoforms |
Number of all proteins |
Number of amino acids |
Min. Seq. Length |
Max. Seq. Length |
Avg. Seq. Length |
Avg. Mol. Weight |
|---|---|---|---|---|---|---|---|
0 |
1776 |
67 |
657 |
296.0 |
33.75 |
Amino acid frequency
Ala |
Cys |
Asp |
Glu |
Phe |
Gly |
His |
Ile |
Lys |
Leu |
|---|---|---|---|---|---|---|---|---|---|
6.025 ± 1.641 | 2.421 ± 0.951 |
4.899 ± 0.425 | 7.601 ± 0.683 |
4.673 ± 0.599 | 6.137 ± 0.71 |
2.309 ± 0.223 | 4.73 ± 0.288 |
6.025 ± 1.616 | 10.586 ± 0.912 |
Met |
Asn |
Gln |
Pro |
Arg |
Ser |
Thr |
Val |
Trp |
Tyr |
|---|---|---|---|---|---|---|---|---|---|
2.365 ± 0.446 | 3.998 ± 0.816 |
5.912 ± 0.762 | 4.955 ± 0.633 |
5.068 ± 0.58 | 5.856 ± 0.226 |
5.743 ± 0.675 | 5.068 ± 0.829 |
1.52 ± 0.268 | 4.11 ± 0.749 |
Most of the basic statistics you can see at this page can be downloaded from this CSV file
Proteome-pI is available under Creative Commons Attribution-NoDerivs license, for more details see here
| Reference: Kozlowski LP. Proteome-pI 2.0: Proteome Isoelectric Point Database Update. Nucleic Acids Res. 2021, doi: 10.1093/nar/gkab944 | Contact: Lukasz P. Kozlowski |
