Marinobacter sp. R17
Taxonomy: cellular organisms; Bacteria; Proteobacteria; Gammaproteobacteria; Alteromonadales; Alteromonadaceae; Marinobacter; unclassified Marinobacter
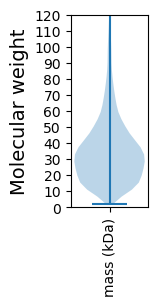
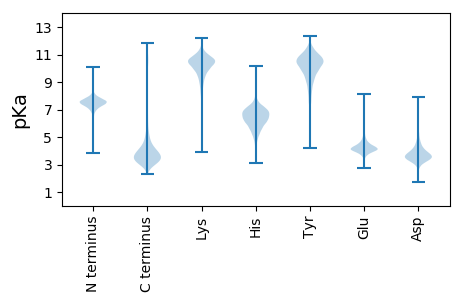
Average proteome isoelectric point is 5.99
Get precalculated fractions of proteins

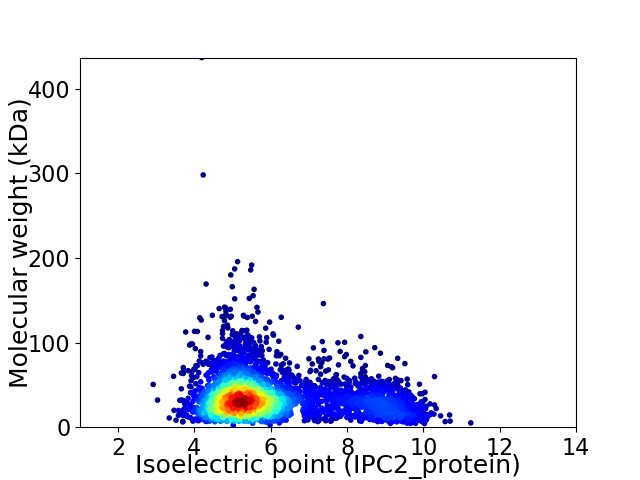
Virtual 2D-PAGE plot for 4075 proteins (isoelectric point calculated using IPC2_protein)
Get csv file with sequences according to given criteria:
* You can choose from 21 different methods for calculating isoelectric point
Summary statistics related to proteome-wise predictions


Protein with the lowest isoelectric point:
>tr|A0A3N2QLJ7|A0A3N2QLJ7_9ALTE Sodium:proton antiporter OS=Marinobacter sp. R17 OX=2484250 GN=EB809_17620 PE=4 SV=1
MM1 pKa = 7.12KK2 pKa = 9.64TLGMLFFLSFLLVGCGGSSSGDD24 pKa = 3.28TSDD27 pKa = 3.53NTSASSDD34 pKa = 3.43SDD36 pKa = 4.61PITGGDD42 pKa = 3.18WYY44 pKa = 11.12QPVPLATWQWQLQGTVDD61 pKa = 3.03TDD63 pKa = 4.11YY64 pKa = 11.56DD65 pKa = 3.95VEE67 pKa = 5.05IYY69 pKa = 10.66DD70 pKa = 4.4IDD72 pKa = 5.24LFDD75 pKa = 6.03SDD77 pKa = 3.98VSLIQSIQATGKK89 pKa = 10.5KK90 pKa = 9.11VICYY94 pKa = 8.54FSAGSYY100 pKa = 9.42EE101 pKa = 3.88NWRR104 pKa = 11.84DD105 pKa = 3.5DD106 pKa = 4.32AGDD109 pKa = 4.12FEE111 pKa = 5.67AADD114 pKa = 4.73LGNSLDD120 pKa = 3.65GWDD123 pKa = 3.64GEE125 pKa = 4.26RR126 pKa = 11.84WLDD129 pKa = 3.36IRR131 pKa = 11.84NEE133 pKa = 3.94NVRR136 pKa = 11.84EE137 pKa = 3.85IMAARR142 pKa = 11.84LDD144 pKa = 3.71LAADD148 pKa = 4.0KK149 pKa = 11.25GCDD152 pKa = 3.46GVEE155 pKa = 4.04PDD157 pKa = 5.34NMDD160 pKa = 4.26GYY162 pKa = 9.77TNDD165 pKa = 3.7PGFDD169 pKa = 3.39FTAADD174 pKa = 3.32QLAYY178 pKa = 10.66NRR180 pKa = 11.84WIANEE185 pKa = 3.55AHH187 pKa = 5.9QRR189 pKa = 11.84TLAVGLKK196 pKa = 10.16NDD198 pKa = 4.05LNQIDD203 pKa = 4.23SLVNYY208 pKa = 10.12FDD210 pKa = 3.86FAVNEE215 pKa = 4.09EE216 pKa = 4.09CFEE219 pKa = 4.01YY220 pKa = 10.86SEE222 pKa = 4.75CDD224 pKa = 3.07RR225 pKa = 11.84LQPFIDD231 pKa = 3.61ANKK234 pKa = 10.0AVLNAEE240 pKa = 4.19YY241 pKa = 10.33QDD243 pKa = 3.89QYY245 pKa = 12.05VNDD248 pKa = 3.71ATARR252 pKa = 11.84AALCTDD258 pKa = 3.32SVNRR262 pKa = 11.84QFSTLVLPLDD272 pKa = 4.17LDD274 pKa = 3.46NSFRR278 pKa = 11.84YY279 pKa = 9.59SCNN282 pKa = 3.16
MM1 pKa = 7.12KK2 pKa = 9.64TLGMLFFLSFLLVGCGGSSSGDD24 pKa = 3.28TSDD27 pKa = 3.53NTSASSDD34 pKa = 3.43SDD36 pKa = 4.61PITGGDD42 pKa = 3.18WYY44 pKa = 11.12QPVPLATWQWQLQGTVDD61 pKa = 3.03TDD63 pKa = 4.11YY64 pKa = 11.56DD65 pKa = 3.95VEE67 pKa = 5.05IYY69 pKa = 10.66DD70 pKa = 4.4IDD72 pKa = 5.24LFDD75 pKa = 6.03SDD77 pKa = 3.98VSLIQSIQATGKK89 pKa = 10.5KK90 pKa = 9.11VICYY94 pKa = 8.54FSAGSYY100 pKa = 9.42EE101 pKa = 3.88NWRR104 pKa = 11.84DD105 pKa = 3.5DD106 pKa = 4.32AGDD109 pKa = 4.12FEE111 pKa = 5.67AADD114 pKa = 4.73LGNSLDD120 pKa = 3.65GWDD123 pKa = 3.64GEE125 pKa = 4.26RR126 pKa = 11.84WLDD129 pKa = 3.36IRR131 pKa = 11.84NEE133 pKa = 3.94NVRR136 pKa = 11.84EE137 pKa = 3.85IMAARR142 pKa = 11.84LDD144 pKa = 3.71LAADD148 pKa = 4.0KK149 pKa = 11.25GCDD152 pKa = 3.46GVEE155 pKa = 4.04PDD157 pKa = 5.34NMDD160 pKa = 4.26GYY162 pKa = 9.77TNDD165 pKa = 3.7PGFDD169 pKa = 3.39FTAADD174 pKa = 3.32QLAYY178 pKa = 10.66NRR180 pKa = 11.84WIANEE185 pKa = 3.55AHH187 pKa = 5.9QRR189 pKa = 11.84TLAVGLKK196 pKa = 10.16NDD198 pKa = 4.05LNQIDD203 pKa = 4.23SLVNYY208 pKa = 10.12FDD210 pKa = 3.86FAVNEE215 pKa = 4.09EE216 pKa = 4.09CFEE219 pKa = 4.01YY220 pKa = 10.86SEE222 pKa = 4.75CDD224 pKa = 3.07RR225 pKa = 11.84LQPFIDD231 pKa = 3.61ANKK234 pKa = 10.0AVLNAEE240 pKa = 4.19YY241 pKa = 10.33QDD243 pKa = 3.89QYY245 pKa = 12.05VNDD248 pKa = 3.71ATARR252 pKa = 11.84AALCTDD258 pKa = 3.32SVNRR262 pKa = 11.84QFSTLVLPLDD272 pKa = 4.17LDD274 pKa = 3.46NSFRR278 pKa = 11.84YY279 pKa = 9.59SCNN282 pKa = 3.16
Molecular weight: 31.44 kDa
Isoelectric point according different methods:
Protein with the highest isoelectric point:
>tr|A0A3N2R0S2|A0A3N2R0S2_9ALTE Glycine--tRNA ligase alpha subunit OS=Marinobacter sp. R17 OX=2484250 GN=glyQ PE=3 SV=1
MM1 pKa = 7.45KK2 pKa = 9.51RR3 pKa = 11.84TFQPSVLKK11 pKa = 10.34RR12 pKa = 11.84KK13 pKa = 9.1RR14 pKa = 11.84VHH16 pKa = 6.26GFRR19 pKa = 11.84ARR21 pKa = 11.84MATANGRR28 pKa = 11.84KK29 pKa = 9.32VIARR33 pKa = 11.84RR34 pKa = 11.84RR35 pKa = 11.84AKK37 pKa = 10.35GRR39 pKa = 11.84ARR41 pKa = 11.84LSAA44 pKa = 3.91
MM1 pKa = 7.45KK2 pKa = 9.51RR3 pKa = 11.84TFQPSVLKK11 pKa = 10.34RR12 pKa = 11.84KK13 pKa = 9.1RR14 pKa = 11.84VHH16 pKa = 6.26GFRR19 pKa = 11.84ARR21 pKa = 11.84MATANGRR28 pKa = 11.84KK29 pKa = 9.32VIARR33 pKa = 11.84RR34 pKa = 11.84RR35 pKa = 11.84AKK37 pKa = 10.35GRR39 pKa = 11.84ARR41 pKa = 11.84LSAA44 pKa = 3.91
Molecular weight: 5.09 kDa
Isoelectric point according different methods:
Peptides (in silico digests for buttom-up proteomics)
Below you can find in silico digests of the whole proteome with Trypsin, Chymotrypsin, Trypsin+LysC, LysN, ArgC proteases suitable for different mass spec machines.| Try ESI |
 |
|---|
| ChTry ESI |
 |
|---|
| ArgC ESI |
 |
|---|
| LysN ESI |
 |
|---|
| TryLysC ESI |
 |
|---|
| Try MALDI |
 |
|---|
| ChTry MALDI |
 |
|---|
| ArgC MALDI |
 |
|---|
| LysN MALDI |
 |
|---|
| TryLysC MALDI |
 |
|---|
| Try LTQ |
 |
|---|
| ChTry LTQ |
 |
|---|
| ArgC LTQ |
 |
|---|
| LysN LTQ |
 |
|---|
| TryLysC LTQ |
 |
|---|
| Try MSlow |
 |
|---|
| ChTry MSlow |
 |
|---|
| ArgC MSlow |
 |
|---|
| LysN MSlow |
 |
|---|
| TryLysC MSlow |
 |
|---|
| Try MShigh |
 |
|---|
| ChTry MShigh |
 |
|---|
| ArgC MShigh |
 |
|---|
| LysN MShigh |
 |
|---|
| TryLysC MShigh |
 |
|---|
General Statistics
Number of major isoforms |
Number of additional isoforms |
Number of all proteins |
Number of amino acids |
Min. Seq. Length |
Max. Seq. Length |
Avg. Seq. Length |
Avg. Mol. Weight |
|---|---|---|---|---|---|---|---|
0 |
1336245 |
21 |
4024 |
327.9 |
36.17 |
Amino acid frequency
Ala |
Cys |
Asp |
Glu |
Phe |
Gly |
His |
Ile |
Lys |
Leu |
|---|---|---|---|---|---|---|---|---|---|
10.126 ± 0.04 | 0.93 ± 0.012 |
6.312 ± 0.032 | 6.174 ± 0.042 |
3.71 ± 0.024 | 7.833 ± 0.035 |
2.308 ± 0.02 | 5.128 ± 0.029 |
3.405 ± 0.034 | 10.647 ± 0.048 |
Met |
Asn |
Gln |
Pro |
Arg |
Ser |
Thr |
Val |
Trp |
Tyr |
|---|---|---|---|---|---|---|---|---|---|
2.523 ± 0.02 | 3.061 ± 0.021 |
4.813 ± 0.026 | 4.069 ± 0.026 |
6.736 ± 0.037 | 5.73 ± 0.029 |
5.268 ± 0.033 | 7.197 ± 0.032 |
1.384 ± 0.017 | 2.648 ± 0.022 |
Most of the basic statistics you can see at this page can be downloaded from this CSV file
Proteome-pI is available under Creative Commons Attribution-NoDerivs license, for more details see here
| Reference: Kozlowski LP. Proteome-pI 2.0: Proteome Isoelectric Point Database Update. Nucleic Acids Res. 2021, doi: 10.1093/nar/gkab944 | Contact: Lukasz P. Kozlowski |
