Broome virus
Taxonomy: Viruses; Riboviria; Orthornavirae; Duplornaviricota; Resentoviricetes; Reovirales; Reoviridae; Spinareovirinae; Orthoreovirus; unclassified Orthoreovirus
Average proteome isoelectric point is 6.32
Get precalculated fractions of proteins

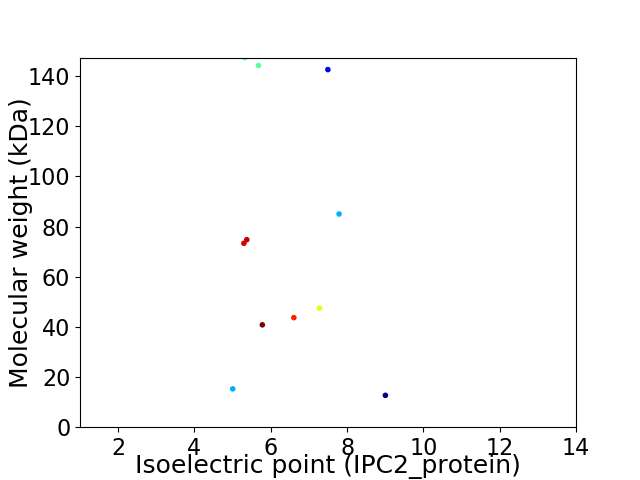
Virtual 2D-PAGE plot for 11 proteins (isoelectric point calculated using IPC2_protein)
Get csv file with sequences according to given criteria:
* You can choose from 21 different methods for calculating isoelectric point
Summary statistics related to proteome-wise predictions


Protein with the lowest isoelectric point:
>tr|D6MM30|D6MM30_9REOV Small non-structural protein p16 OS=Broome virus OX=667093 PE=4 SV=1
MM1 pKa = 7.7EE2 pKa = 5.05FPSFEE7 pKa = 3.78WLSFNEE13 pKa = 4.11LKK15 pKa = 10.65KK16 pKa = 9.64ITVGEE21 pKa = 4.22VAPFLCDD28 pKa = 3.64HH29 pKa = 6.65EE30 pKa = 5.04CKK32 pKa = 10.53AWMPFWIIMRR42 pKa = 11.84QEE44 pKa = 3.75SHH46 pKa = 6.84FEE48 pKa = 3.99GMSTLRR54 pKa = 11.84MVHH57 pKa = 6.89LFHH60 pKa = 6.75EE61 pKa = 4.84WVWMCLHH68 pKa = 6.54EE69 pKa = 4.9NEE71 pKa = 4.72CLRR74 pKa = 11.84NRR76 pKa = 11.84YY77 pKa = 6.29TLWFVEE83 pKa = 4.39CLQTRR88 pKa = 11.84FGDD91 pKa = 4.57LNNADD96 pKa = 3.48YY97 pKa = 10.18WIGRR101 pKa = 11.84RR102 pKa = 11.84FAKK105 pKa = 10.4FVYY108 pKa = 9.83DD109 pKa = 4.04RR110 pKa = 11.84CLLLQDD116 pKa = 4.66DD117 pKa = 4.8EE118 pKa = 4.41MMEE121 pKa = 4.08IDD123 pKa = 3.66VV124 pKa = 4.37
MM1 pKa = 7.7EE2 pKa = 5.05FPSFEE7 pKa = 3.78WLSFNEE13 pKa = 4.11LKK15 pKa = 10.65KK16 pKa = 9.64ITVGEE21 pKa = 4.22VAPFLCDD28 pKa = 3.64HH29 pKa = 6.65EE30 pKa = 5.04CKK32 pKa = 10.53AWMPFWIIMRR42 pKa = 11.84QEE44 pKa = 3.75SHH46 pKa = 6.84FEE48 pKa = 3.99GMSTLRR54 pKa = 11.84MVHH57 pKa = 6.89LFHH60 pKa = 6.75EE61 pKa = 4.84WVWMCLHH68 pKa = 6.54EE69 pKa = 4.9NEE71 pKa = 4.72CLRR74 pKa = 11.84NRR76 pKa = 11.84YY77 pKa = 6.29TLWFVEE83 pKa = 4.39CLQTRR88 pKa = 11.84FGDD91 pKa = 4.57LNNADD96 pKa = 3.48YY97 pKa = 10.18WIGRR101 pKa = 11.84RR102 pKa = 11.84FAKK105 pKa = 10.4FVYY108 pKa = 9.83DD109 pKa = 4.04RR110 pKa = 11.84CLLLQDD116 pKa = 4.66DD117 pKa = 4.8EE118 pKa = 4.41MMEE121 pKa = 4.08IDD123 pKa = 3.66VV124 pKa = 4.37
Molecular weight: 15.27 kDa
Isoelectric point according different methods:
Protein with the highest isoelectric point:
>tr|D6MM30|D6MM30_9REOV Small non-structural protein p16 OS=Broome virus OX=667093 PE=4 SV=1
MM1 pKa = 7.64GSGPSNFVNKK11 pKa = 9.73VDD13 pKa = 4.12GASAPIKK20 pKa = 9.73EE21 pKa = 4.23HH22 pKa = 7.16AIPSLTSDD30 pKa = 3.83LKK32 pKa = 11.1DD33 pKa = 3.42YY34 pKa = 10.98LYY36 pKa = 10.6TIVTAVILLVILWFLYY52 pKa = 10.06RR53 pKa = 11.84YY54 pKa = 10.22YY55 pKa = 10.78KK56 pKa = 10.4DD57 pKa = 2.86KK58 pKa = 10.87KK59 pKa = 10.18ARR61 pKa = 11.84KK62 pKa = 8.67KK63 pKa = 10.94KK64 pKa = 10.35EE65 pKa = 4.39DD66 pKa = 3.23ILLRR70 pKa = 11.84LYY72 pKa = 11.06GRR74 pKa = 11.84GLNLSRR80 pKa = 11.84LDD82 pKa = 3.58PSVICSLGGSAPNLQHH98 pKa = 7.12RR99 pKa = 11.84GLEE102 pKa = 4.02RR103 pKa = 11.84TEE105 pKa = 4.48DD106 pKa = 3.46KK107 pKa = 10.92LVNPFII113 pKa = 5.36
MM1 pKa = 7.64GSGPSNFVNKK11 pKa = 9.73VDD13 pKa = 4.12GASAPIKK20 pKa = 9.73EE21 pKa = 4.23HH22 pKa = 7.16AIPSLTSDD30 pKa = 3.83LKK32 pKa = 11.1DD33 pKa = 3.42YY34 pKa = 10.98LYY36 pKa = 10.6TIVTAVILLVILWFLYY52 pKa = 10.06RR53 pKa = 11.84YY54 pKa = 10.22YY55 pKa = 10.78KK56 pKa = 10.4DD57 pKa = 2.86KK58 pKa = 10.87KK59 pKa = 10.18ARR61 pKa = 11.84KK62 pKa = 8.67KK63 pKa = 10.94KK64 pKa = 10.35EE65 pKa = 4.39DD66 pKa = 3.23ILLRR70 pKa = 11.84LYY72 pKa = 11.06GRR74 pKa = 11.84GLNLSRR80 pKa = 11.84LDD82 pKa = 3.58PSVICSLGGSAPNLQHH98 pKa = 7.12RR99 pKa = 11.84GLEE102 pKa = 4.02RR103 pKa = 11.84TEE105 pKa = 4.48DD106 pKa = 3.46KK107 pKa = 10.92LVNPFII113 pKa = 5.36
Molecular weight: 12.71 kDa
Isoelectric point according different methods:
Peptides (in silico digests for buttom-up proteomics)
Below you can find in silico digests of the whole proteome with Trypsin, Chymotrypsin, Trypsin+LysC, LysN, ArgC proteases suitable for different mass spec machines.| Try ESI |
 |
|---|
| ChTry ESI |
 |
|---|
| ArgC ESI |
 |
|---|
| LysN ESI |
 |
|---|
| TryLysC ESI |
 |
|---|
| Try MALDI |
 |
|---|
| ChTry MALDI |
 |
|---|
| ArgC MALDI |
 |
|---|
| LysN MALDI |
 |
|---|
| TryLysC MALDI |
 |
|---|
| Try LTQ |
 |
|---|
| ChTry LTQ |
 |
|---|
| ArgC LTQ |
 |
|---|
| LysN LTQ |
 |
|---|
| TryLysC LTQ |
 |
|---|
| Try MSlow |
 |
|---|
| ChTry MSlow |
 |
|---|
| ArgC MSlow |
 |
|---|
| LysN MSlow |
 |
|---|
| TryLysC MSlow |
 |
|---|
| Try MShigh |
 |
|---|
| ChTry MShigh |
 |
|---|
| ArgC MShigh |
 |
|---|
| LysN MShigh |
 |
|---|
| TryLysC MShigh |
 |
|---|
General Statistics
Number of major isoforms |
Number of additional isoforms |
Number of all proteins |
Number of amino acids |
Min. Seq. Length |
Max. Seq. Length |
Avg. Seq. Length |
Avg. Mol. Weight |
|---|---|---|---|---|---|---|---|
0 |
7327 |
113 |
1297 |
666.1 |
75.19 |
Amino acid frequency
Ala |
Cys |
Asp |
Glu |
Phe |
Gly |
His |
Ile |
Lys |
Leu |
|---|---|---|---|---|---|---|---|---|---|
7.22 ± 0.441 | 1.72 ± 0.133 |
6.278 ± 0.285 | 4.518 ± 0.404 |
4.067 ± 0.299 | 5.705 ± 0.138 |
2.443 ± 0.271 | 5.623 ± 0.233 |
3.439 ± 0.458 | 9.895 ± 0.391 |
Met |
Asn |
Gln |
Pro |
Arg |
Ser |
Thr |
Val |
Trp |
Tyr |
|---|---|---|---|---|---|---|---|---|---|
3.344 ± 0.264 | 4.831 ± 0.279 |
5.077 ± 0.425 | 3.48 ± 0.18 |
6.497 ± 0.246 | 7.07 ± 0.344 |
5.528 ± 0.329 | 7.602 ± 0.208 |
1.61 ± 0.151 | 4.054 ± 0.343 |
Most of the basic statistics you can see at this page can be downloaded from this CSV file
Proteome-pI is available under Creative Commons Attribution-NoDerivs license, for more details see here
| Reference: Kozlowski LP. Proteome-pI 2.0: Proteome Isoelectric Point Database Update. Nucleic Acids Res. 2021, doi: 10.1093/nar/gkab944 | Contact: Lukasz P. Kozlowski |
