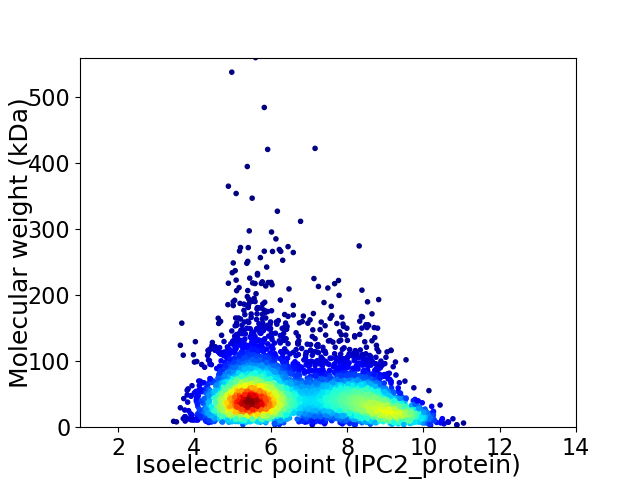
Schizosaccharomyces pombe (strain 972 / ATCC 24843) (Fission yeast)
Taxonomy: cellular organisms; Eukaryota; Opisthokonta; Fungi; Dikarya; Ascomycota; Taphrinomycotina; Schizosaccharomycetes; Schizosaccharomycetales; Schizosaccharomycetaceae; Schizosaccharomyces; Schizosaccharomyces pombe
Average proteome isoelectric point is 6.67
Get precalculated fractions of proteins

Virtual 2D-PAGE plot for 5151 proteins (isoelectric point calculated using IPC2_protein)
Get csv file with sequences according to given criteria:
* You can choose from 21 different methods for calculating isoelectric point
Summary statistics related to proteome-wise predictions


Protein with the lowest isoelectric point:
>sp|O13969|SYTM_SCHPO Probable threonine--tRNA ligase mitochondrial OS=Schizosaccharomyces pombe (strain 972 / ATCC 24843) OX=284812 GN=SPAC24C9.09 PE=3 SV=2
MM1 pKa = 7.47LFKK4 pKa = 10.99SFALTLLFAAARR16 pKa = 11.84VQAASNCSSGPYY28 pKa = 9.69NISAQGTLDD37 pKa = 3.7EE38 pKa = 5.45LNSCTVLNGDD48 pKa = 5.31LYY50 pKa = 10.77ISDD53 pKa = 4.64AGNSGITTLTVNGIEE68 pKa = 4.3SVQGDD73 pKa = 4.11VVVSDD78 pKa = 3.78GQYY81 pKa = 9.1LTSLSFPSLKK91 pKa = 10.35NVSGAFNVNNMIRR104 pKa = 11.84MNNLATPEE112 pKa = 4.08LTSVGSLNLAVLPNLQEE129 pKa = 4.11LQFNAGLSDD138 pKa = 3.64SDD140 pKa = 4.27SVVIDD145 pKa = 3.74DD146 pKa = 4.67TQLQAIDD153 pKa = 5.12GISLDD158 pKa = 3.81SVTTFQVTNNRR169 pKa = 11.84YY170 pKa = 7.91IQEE173 pKa = 3.7ITMEE177 pKa = 4.38GLEE180 pKa = 4.27SAQNIQISANSKK192 pKa = 8.5GVSVNFSKK200 pKa = 11.0LSNVTTATFDD210 pKa = 4.08GISNVFIGNLKK221 pKa = 9.74SAAGNLYY228 pKa = 10.45FSNTTLDD235 pKa = 4.31NISVPYY241 pKa = 8.75LTEE244 pKa = 4.59IGQSFAVLYY253 pKa = 10.62SPEE256 pKa = 4.18LTSLNFPNLTTVGGGFVINDD276 pKa = 3.75TGLTSIDD283 pKa = 3.66GFPVISEE290 pKa = 3.92IGGGLVLLGNFSSIDD305 pKa = 3.67MPDD308 pKa = 3.28LSDD311 pKa = 3.45VKK313 pKa = 10.96GALTVEE319 pKa = 4.88TKK321 pKa = 9.4ATNFTCPWSNDD332 pKa = 3.08DD333 pKa = 5.11SVIKK337 pKa = 10.76GDD339 pKa = 5.22DD340 pKa = 3.7FTCQGSVATISATSSYY356 pKa = 10.67DD357 pKa = 3.35LSSTVSATSGSATSATGSATTTSYY381 pKa = 11.53SSDD384 pKa = 3.06SSASSSSSSSHH395 pKa = 5.98EE396 pKa = 3.83SSAASNGFTAGALVLGSLLVAALAMM421 pKa = 4.66
MM1 pKa = 7.47LFKK4 pKa = 10.99SFALTLLFAAARR16 pKa = 11.84VQAASNCSSGPYY28 pKa = 9.69NISAQGTLDD37 pKa = 3.7EE38 pKa = 5.45LNSCTVLNGDD48 pKa = 5.31LYY50 pKa = 10.77ISDD53 pKa = 4.64AGNSGITTLTVNGIEE68 pKa = 4.3SVQGDD73 pKa = 4.11VVVSDD78 pKa = 3.78GQYY81 pKa = 9.1LTSLSFPSLKK91 pKa = 10.35NVSGAFNVNNMIRR104 pKa = 11.84MNNLATPEE112 pKa = 4.08LTSVGSLNLAVLPNLQEE129 pKa = 4.11LQFNAGLSDD138 pKa = 3.64SDD140 pKa = 4.27SVVIDD145 pKa = 3.74DD146 pKa = 4.67TQLQAIDD153 pKa = 5.12GISLDD158 pKa = 3.81SVTTFQVTNNRR169 pKa = 11.84YY170 pKa = 7.91IQEE173 pKa = 3.7ITMEE177 pKa = 4.38GLEE180 pKa = 4.27SAQNIQISANSKK192 pKa = 8.5GVSVNFSKK200 pKa = 11.0LSNVTTATFDD210 pKa = 4.08GISNVFIGNLKK221 pKa = 9.74SAAGNLYY228 pKa = 10.45FSNTTLDD235 pKa = 4.31NISVPYY241 pKa = 8.75LTEE244 pKa = 4.59IGQSFAVLYY253 pKa = 10.62SPEE256 pKa = 4.18LTSLNFPNLTTVGGGFVINDD276 pKa = 3.75TGLTSIDD283 pKa = 3.66GFPVISEE290 pKa = 3.92IGGGLVLLGNFSSIDD305 pKa = 3.67MPDD308 pKa = 3.28LSDD311 pKa = 3.45VKK313 pKa = 10.96GALTVEE319 pKa = 4.88TKK321 pKa = 9.4ATNFTCPWSNDD332 pKa = 3.08DD333 pKa = 5.11SVIKK337 pKa = 10.76GDD339 pKa = 5.22DD340 pKa = 3.7FTCQGSVATISATSSYY356 pKa = 10.67DD357 pKa = 3.35LSSTVSATSGSATSATGSATTTSYY381 pKa = 11.53SSDD384 pKa = 3.06SSASSSSSSSHH395 pKa = 5.98EE396 pKa = 3.83SSAASNGFTAGALVLGSLLVAALAMM421 pKa = 4.66
Molecular weight: 43.35 kDa
Isoelectric point according different methods:
Protein with the highest isoelectric point:
>sp|P0CT98|YM01_SCHPO UPF0494 membrane protein SPAC212.01c OS=Schizosaccharomyces pombe (strain 972 / ATCC 24843) OX=284812 GN=SPAC212.01c PE=3 SV=1
MRDKWRKKRVRRLKRKRRKMRARSK
MRDKWRKKRVRRLKRKRRKMRARSK
Molecular weight: 3.41 kDa
Isoelectric point according different methods:
Peptides (in silico digests for buttom-up proteomics)
Below you can find in silico digests of the whole proteome with Trypsin, Chymotrypsin, Trypsin+LysC, LysN, ArgC proteases suitable for different mass spec machines.| Try ESI |
 |
|---|
| ChTry ESI |
 |
|---|
| ArgC ESI |
 |
|---|
| LysN ESI |
 |
|---|
| TryLysC ESI |
 |
|---|
| Try MALDI |
 |
|---|
| ChTry MALDI |
 |
|---|
| ArgC MALDI |
 |
|---|
| LysN MALDI |
 |
|---|
| TryLysC MALDI |
 |
|---|
| Try LTQ |
 |
|---|
| ChTry LTQ |
 |
|---|
| ArgC LTQ |
 |
|---|
| LysN LTQ |
 |
|---|
| TryLysC LTQ |
 |
|---|
| Try MSlow |
 |
|---|
| ChTry MSlow |
 |
|---|
| ArgC MSlow |
 |
|---|
| LysN MSlow |
 |
|---|
| TryLysC MSlow |
 |
|---|
| Try MShigh |
 |
|---|
| ChTry MShigh |
 |
|---|
| ArgC MShigh |
 |
|---|
| LysN MShigh |
 |
|---|
| TryLysC MShigh |
 |
|---|
General Statistics
Number of major isoforms |
Number of additional isoforms |
Number of all proteins |
Number of amino acids |
Min. Seq. Length |
Max. Seq. Length |
Avg. Seq. Length |
Avg. Mol. Weight |
|---|---|---|---|---|---|---|---|
2391875 |
24 |
4924 |
464.4 |
52.37 |
Amino acid frequency
Ala |
Cys |
Asp |
Glu |
Phe |
Gly |
His |
Ile |
Lys |
Leu |
|---|---|---|---|---|---|---|---|---|---|
6.224 ± 0.024 | 1.468 ± 0.013 |
5.339 ± 0.022 | 6.522 ± 0.034 |
4.616 ± 0.025 | 4.929 ± 0.03 |
2.26 ± 0.014 | 6.158 ± 0.025 |
6.433 ± 0.033 | 9.871 ± 0.042 |
Met |
Asn |
Gln |
Pro |
Arg |
Ser |
Thr |
Val |
Trp |
Tyr |
|---|---|---|---|---|---|---|---|---|---|
2.067 ± 0.013 | 5.212 ± 0.02 |
4.713 ± 0.026 | 3.819 ± 0.023 |
4.867 ± 0.023 | 9.425 ± 0.058 |
5.506 ± 0.045 | 6.035 ± 0.022 |
1.119 ± 0.011 | 3.419 ± 0.021 |
Most of the basic statistics you can see at this page can be downloaded from this CSV file
Proteome-pI is available under Creative Commons Attribution-NoDerivs license, for more details see here
| Reference: Kozlowski LP. Proteome-pI 2.0: Proteome Isoelectric Point Database Update. Nucleic Acids Res. 2021, doi: 10.1093/nar/gkab944 | Contact: Lukasz P. Kozlowski |
