Pseudomonas virus LPB1
Taxonomy: Viruses; Duplodnaviria; Heunggongvirae; Uroviricota; Caudoviricetes; Caudovirales; Siphoviridae; Casadabanvirus
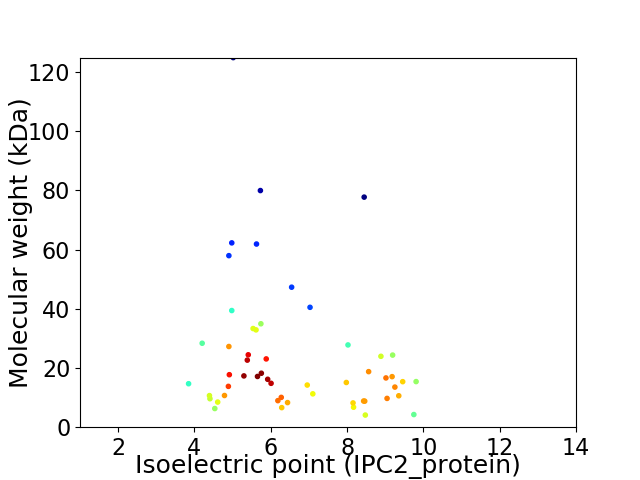
Average proteome isoelectric point is 6.66
Get precalculated fractions of proteins

Virtual 2D-PAGE plot for 54 proteins (isoelectric point calculated using IPC2_protein)
Get csv file with sequences according to given criteria:
* You can choose from 21 different methods for calculating isoelectric point
Summary statistics related to proteome-wise predictions


Protein with the lowest isoelectric point:
>tr|H1ZZC0|H1ZZC0_9CAUD A Transposase OS=Pseudomonas virus LPB1 OX=1091556 PE=4 SV=1
MM1 pKa = 7.67TNTDD5 pKa = 4.59LKK7 pKa = 11.09PLFDD11 pKa = 3.99NLRR14 pKa = 11.84NATEE18 pKa = 4.56FFNSVDD24 pKa = 3.43GDD26 pKa = 3.91LASICNGTKK35 pKa = 10.18QIAAEE40 pKa = 3.99WLEE43 pKa = 4.17TAALALGDD51 pKa = 4.49ALIAQCEE58 pKa = 4.13AVTQEE63 pKa = 4.4DD64 pKa = 4.53SVDD67 pKa = 3.23GRR69 pKa = 11.84PRR71 pKa = 11.84AIEE74 pKa = 4.07CPVCGEE80 pKa = 4.06QEE82 pKa = 4.26LMPGNLCACGYY93 pKa = 7.15EE94 pKa = 4.07TDD96 pKa = 4.09PAAGCACPEE105 pKa = 4.39CDD107 pKa = 4.63GSGDD111 pKa = 3.66GCVGEE116 pKa = 4.47VCRR119 pKa = 11.84EE120 pKa = 3.88CDD122 pKa = 3.24GSGWFVRR129 pKa = 11.84PTAKK133 pKa = 10.34DD134 pKa = 3.19DD135 pKa = 4.48GGDD138 pKa = 3.52HH139 pKa = 6.32EE140 pKa = 4.77
MM1 pKa = 7.67TNTDD5 pKa = 4.59LKK7 pKa = 11.09PLFDD11 pKa = 3.99NLRR14 pKa = 11.84NATEE18 pKa = 4.56FFNSVDD24 pKa = 3.43GDD26 pKa = 3.91LASICNGTKK35 pKa = 10.18QIAAEE40 pKa = 3.99WLEE43 pKa = 4.17TAALALGDD51 pKa = 4.49ALIAQCEE58 pKa = 4.13AVTQEE63 pKa = 4.4DD64 pKa = 4.53SVDD67 pKa = 3.23GRR69 pKa = 11.84PRR71 pKa = 11.84AIEE74 pKa = 4.07CPVCGEE80 pKa = 4.06QEE82 pKa = 4.26LMPGNLCACGYY93 pKa = 7.15EE94 pKa = 4.07TDD96 pKa = 4.09PAAGCACPEE105 pKa = 4.39CDD107 pKa = 4.63GSGDD111 pKa = 3.66GCVGEE116 pKa = 4.47VCRR119 pKa = 11.84EE120 pKa = 3.88CDD122 pKa = 3.24GSGWFVRR129 pKa = 11.84PTAKK133 pKa = 10.34DD134 pKa = 3.19DD135 pKa = 4.48GGDD138 pKa = 3.52HH139 pKa = 6.32EE140 pKa = 4.77
Molecular weight: 14.68 kDa
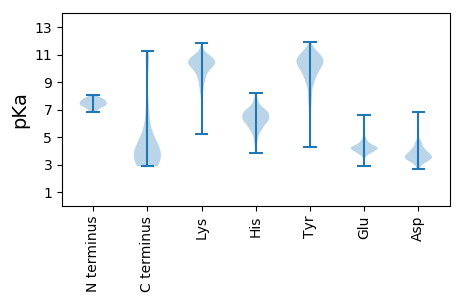
Isoelectric point according different methods:
Protein with the highest isoelectric point:
>tr|H1ZZD2|H1ZZD2_9CAUD Putative Mor OS=Pseudomonas virus LPB1 OX=1091556 PE=4 SV=1
MM1 pKa = 7.59SLRR4 pKa = 11.84AVNLAKK10 pKa = 10.31IHH12 pKa = 5.98IAKK15 pKa = 8.12TQLGMDD21 pKa = 4.37DD22 pKa = 3.49DD23 pKa = 4.54TYY25 pKa = 11.18RR26 pKa = 11.84ALLARR31 pKa = 11.84VAGVRR36 pKa = 11.84SAKK39 pKa = 10.42DD40 pKa = 3.08LGPRR44 pKa = 11.84QVGKK48 pKa = 10.77VLAEE52 pKa = 4.0FQRR55 pKa = 11.84LGWKK59 pKa = 9.51PKK61 pKa = 9.59SNRR64 pKa = 11.84QGRR67 pKa = 11.84EE68 pKa = 3.88TPKK71 pKa = 10.23VPQNRR76 pKa = 11.84QTVLRR81 pKa = 11.84KK82 pKa = 8.56ITALLASAHH91 pKa = 6.36RR92 pKa = 11.84PWSYY96 pKa = 10.43ADD98 pKa = 3.09HH99 pKa = 6.39MARR102 pKa = 11.84RR103 pKa = 11.84MFQVEE108 pKa = 4.06RR109 pKa = 11.84VEE111 pKa = 4.2WLDD114 pKa = 4.16DD115 pKa = 3.66SQLYY119 pKa = 10.69RR120 pKa = 11.84LMQALIIDD128 pKa = 4.49RR129 pKa = 11.84SRR131 pKa = 11.84HH132 pKa = 4.02EE133 pKa = 3.81
MM1 pKa = 7.59SLRR4 pKa = 11.84AVNLAKK10 pKa = 10.31IHH12 pKa = 5.98IAKK15 pKa = 8.12TQLGMDD21 pKa = 4.37DD22 pKa = 3.49DD23 pKa = 4.54TYY25 pKa = 11.18RR26 pKa = 11.84ALLARR31 pKa = 11.84VAGVRR36 pKa = 11.84SAKK39 pKa = 10.42DD40 pKa = 3.08LGPRR44 pKa = 11.84QVGKK48 pKa = 10.77VLAEE52 pKa = 4.0FQRR55 pKa = 11.84LGWKK59 pKa = 9.51PKK61 pKa = 9.59SNRR64 pKa = 11.84QGRR67 pKa = 11.84EE68 pKa = 3.88TPKK71 pKa = 10.23VPQNRR76 pKa = 11.84QTVLRR81 pKa = 11.84KK82 pKa = 8.56ITALLASAHH91 pKa = 6.36RR92 pKa = 11.84PWSYY96 pKa = 10.43ADD98 pKa = 3.09HH99 pKa = 6.39MARR102 pKa = 11.84RR103 pKa = 11.84MFQVEE108 pKa = 4.06RR109 pKa = 11.84VEE111 pKa = 4.2WLDD114 pKa = 4.16DD115 pKa = 3.66SQLYY119 pKa = 10.69RR120 pKa = 11.84LMQALIIDD128 pKa = 4.49RR129 pKa = 11.84SRR131 pKa = 11.84HH132 pKa = 4.02EE133 pKa = 3.81
Molecular weight: 15.4 kDa
Isoelectric point according different methods:
Peptides (in silico digests for buttom-up proteomics)
Below you can find in silico digests of the whole proteome with Trypsin, Chymotrypsin, Trypsin+LysC, LysN, ArgC proteases suitable for different mass spec machines.| Try ESI |
 |
|---|
| ChTry ESI |
 |
|---|
| ArgC ESI |
 |
|---|
| LysN ESI |
 |
|---|
| TryLysC ESI |
 |
|---|
| Try MALDI |
 |
|---|
| ChTry MALDI |
 |
|---|
| ArgC MALDI |
 |
|---|
| LysN MALDI |
 |
|---|
| TryLysC MALDI |
 |
|---|
| Try LTQ |
 |
|---|
| ChTry LTQ |
 |
|---|
| ArgC LTQ |
 |
|---|
| LysN LTQ |
 |
|---|
| TryLysC LTQ |
 |
|---|
| Try MSlow |
 |
|---|
| ChTry MSlow |
 |
|---|
| ArgC MSlow |
 |
|---|
| LysN MSlow |
 |
|---|
| TryLysC MSlow |
 |
|---|
| Try MShigh |
 |
|---|
| ChTry MShigh |
 |
|---|
| ArgC MShigh |
 |
|---|
| LysN MShigh |
 |
|---|
| TryLysC MShigh |
 |
|---|
General Statistics
Number of major isoforms |
Number of additional isoforms |
Number of all proteins |
Number of amino acids |
Min. Seq. Length |
Max. Seq. Length |
Avg. Seq. Length |
Avg. Mol. Weight |
|---|---|---|---|---|---|---|---|
0 |
11908 |
38 |
1186 |
220.5 |
24.12 |
Amino acid frequency
Ala |
Cys |
Asp |
Glu |
Phe |
Gly |
His |
Ile |
Lys |
Leu |
|---|---|---|---|---|---|---|---|---|---|
12.588 ± 0.59 | 0.974 ± 0.154 |
5.979 ± 0.202 | 5.744 ± 0.27 |
2.914 ± 0.193 | 8.003 ± 0.365 |
1.57 ± 0.154 | 4.157 ± 0.186 |
3.502 ± 0.282 | 9.531 ± 0.331 |
Met |
Asn |
Gln |
Pro |
Arg |
Ser |
Thr |
Val |
Trp |
Tyr |
|---|---|---|---|---|---|---|---|---|---|
2.209 ± 0.14 | 2.906 ± 0.218 |
5.039 ± 0.286 | 5.055 ± 0.35 |
7.314 ± 0.423 | 5.761 ± 0.221 |
5.509 ± 0.255 | 6.676 ± 0.259 |
1.806 ± 0.133 | 2.763 ± 0.193 |
Most of the basic statistics you can see at this page can be downloaded from this CSV file
Proteome-pI is available under Creative Commons Attribution-NoDerivs license, for more details see here
| Reference: Kozlowski LP. Proteome-pI 2.0: Proteome Isoelectric Point Database Update. Nucleic Acids Res. 2021, doi: 10.1093/nar/gkab944 | Contact: Lukasz P. Kozlowski |
