Aspergillus lentulus
Taxonomy: cellular organisms; Eukaryota; Opisthokonta; Fungi; Dikarya; Ascomycota; saccharomyceta; Pezizomycotina; leotiomyceta; Eurotiomycetes; Eurotiomycetidae; Eurotiales; Aspergillaceae; Aspergillus
Average proteome isoelectric point is 6.4
Get precalculated fractions of proteins

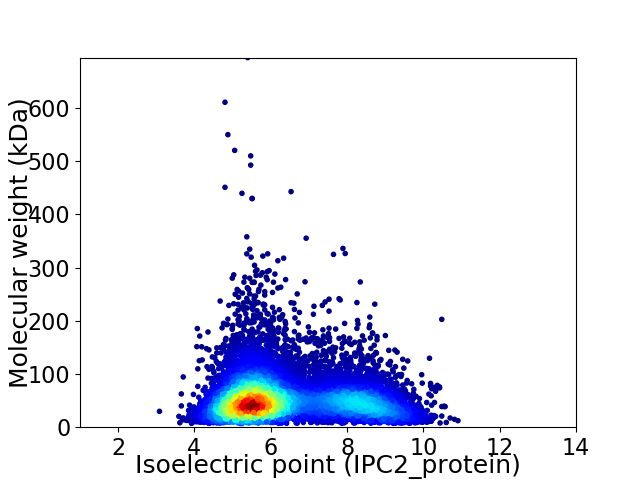
Virtual 2D-PAGE plot for 9664 proteins (isoelectric point calculated using IPC2_protein)
Get csv file with sequences according to given criteria:
* You can choose from 21 different methods for calculating isoelectric point
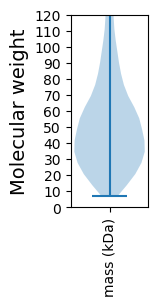
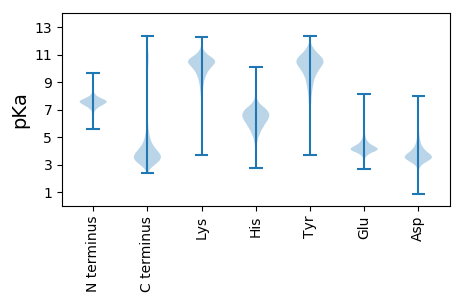
Summary statistics related to proteome-wise predictions


Protein with the lowest isoelectric point:
>tr|A0A0S7DEQ0|A0A0S7DEQ0_9EURO Uncharacterized protein OS=Aspergillus lentulus OX=293939 GN=ALT_0424 PE=3 SV=1
MM1 pKa = 7.39HH2 pKa = 7.57LALSLLALSATSTLAAPVNTLPQNQDD28 pKa = 2.49SNAPTRR34 pKa = 11.84TARR37 pKa = 11.84LLTPISHH44 pKa = 7.29PSKK47 pKa = 10.47EE48 pKa = 4.11DD49 pKa = 3.11SHH51 pKa = 7.9LKK53 pKa = 10.6ARR55 pKa = 11.84TFGLLSGLLSHH66 pKa = 6.81GFGGSGSAEE75 pKa = 3.9CEE77 pKa = 3.97ACEE80 pKa = 4.45GEE82 pKa = 4.42AGGSAGGSGGWGGLGFGGHH101 pKa = 6.96LGGGLGGHH109 pKa = 7.45LGGGLGGGLGLGGSAGSGEE128 pKa = 4.35DD129 pKa = 3.5CDD131 pKa = 4.37EE132 pKa = 4.47NGEE135 pKa = 4.37GGVSVGGSAGGSAGGSAGGSAGGSAGGSAGGSAGGSAGGSAGGSAGGSAGGSLGGSVGGSAGGSAGGSAGGDD207 pKa = 3.25TGASATGSGSAGGSATGSLGGSASGTAGGSLGGSAGGSAGGSASGTAGGSAGGSATGSLGGSATGSAGGSAGGSAGGDD285 pKa = 3.25TGASATGSGSGSTGGSATGSVGGSGSVGGSAGGSAGGSAGGSAGGDD331 pKa = 3.25TGASATGSGSGSTEE345 pKa = 3.8GSGSTGGSASGSAGGDD361 pKa = 3.15TGASATGSGSGSTEE375 pKa = 3.71GSGSGSGSVGGSAGGSAGGSGSSSGGISIGGSATGTGGASASATASASAGASASAGASATGGSGSDD441 pKa = 3.23NGEE444 pKa = 4.31DD445 pKa = 4.06CDD447 pKa = 4.11EE448 pKa = 4.57TGADD452 pKa = 3.83ATTGDD457 pKa = 3.86NGDD460 pKa = 4.74DD461 pKa = 3.76YY462 pKa = 11.87GNDD465 pKa = 3.38AGEE468 pKa = 4.94GDD470 pKa = 4.5DD471 pKa = 4.89SSAGGDD477 pKa = 3.52DD478 pKa = 6.28SEE480 pKa = 6.76DD481 pKa = 3.84CDD483 pKa = 5.05CDD485 pKa = 3.39QQ486 pKa = 5.07
MM1 pKa = 7.39HH2 pKa = 7.57LALSLLALSATSTLAAPVNTLPQNQDD28 pKa = 2.49SNAPTRR34 pKa = 11.84TARR37 pKa = 11.84LLTPISHH44 pKa = 7.29PSKK47 pKa = 10.47EE48 pKa = 4.11DD49 pKa = 3.11SHH51 pKa = 7.9LKK53 pKa = 10.6ARR55 pKa = 11.84TFGLLSGLLSHH66 pKa = 6.81GFGGSGSAEE75 pKa = 3.9CEE77 pKa = 3.97ACEE80 pKa = 4.45GEE82 pKa = 4.42AGGSAGGSGGWGGLGFGGHH101 pKa = 6.96LGGGLGGHH109 pKa = 7.45LGGGLGGGLGLGGSAGSGEE128 pKa = 4.35DD129 pKa = 3.5CDD131 pKa = 4.37EE132 pKa = 4.47NGEE135 pKa = 4.37GGVSVGGSAGGSAGGSAGGSAGGSAGGSAGGSAGGSAGGSAGGSAGGSAGGSLGGSVGGSAGGSAGGSAGGDD207 pKa = 3.25TGASATGSGSAGGSATGSLGGSASGTAGGSLGGSAGGSAGGSASGTAGGSAGGSATGSLGGSATGSAGGSAGGSAGGDD285 pKa = 3.25TGASATGSGSGSTGGSATGSVGGSGSVGGSAGGSAGGSAGGSAGGDD331 pKa = 3.25TGASATGSGSGSTEE345 pKa = 3.8GSGSTGGSASGSAGGDD361 pKa = 3.15TGASATGSGSGSTEE375 pKa = 3.71GSGSGSGSVGGSAGGSAGGSGSSSGGISIGGSATGTGGASASATASASAGASASAGASATGGSGSDD441 pKa = 3.23NGEE444 pKa = 4.31DD445 pKa = 4.06CDD447 pKa = 4.11EE448 pKa = 4.57TGADD452 pKa = 3.83ATTGDD457 pKa = 3.86NGDD460 pKa = 4.74DD461 pKa = 3.76YY462 pKa = 11.87GNDD465 pKa = 3.38AGEE468 pKa = 4.94GDD470 pKa = 4.5DD471 pKa = 4.89SSAGGDD477 pKa = 3.52DD478 pKa = 6.28SEE480 pKa = 6.76DD481 pKa = 3.84CDD483 pKa = 5.05CDD485 pKa = 3.39QQ486 pKa = 5.07
Molecular weight: 39.99 kDa
Isoelectric point according different methods:
Protein with the highest isoelectric point:
>tr|A0A0S7E3I2|A0A0S7E3I2_9EURO Uncharacterized protein OS=Aspergillus lentulus OX=293939 GN=ALT_7575 PE=4 SV=1
MM1 pKa = 7.4ASLWRR6 pKa = 11.84RR7 pKa = 11.84ILPQRR12 pKa = 11.84VANSGSQLRR21 pKa = 11.84DD22 pKa = 3.2HH23 pKa = 6.56QANEE27 pKa = 3.99RR28 pKa = 11.84TFLSWTRR35 pKa = 11.84MGLGFAAMALALGRR49 pKa = 11.84LDD51 pKa = 4.6AIDD54 pKa = 5.07RR55 pKa = 11.84IISSGLSSSKK65 pKa = 11.14SNLLVVPDD73 pKa = 3.8NAGAGAAATAGRR85 pKa = 11.84SGNNINSTEE94 pKa = 3.9QQPNQISTYY103 pKa = 9.95LGSGLSAATLCQAISVWSFGYY124 pKa = 10.89GIFRR128 pKa = 11.84YY129 pKa = 10.16LSVRR133 pKa = 11.84RR134 pKa = 11.84NLLKK138 pKa = 10.92GQFTPAIWGPAFITCGCLGVFSSMGLWMEE167 pKa = 3.99RR168 pKa = 11.84RR169 pKa = 11.84DD170 pKa = 4.04KK171 pKa = 11.23KK172 pKa = 10.09MHH174 pKa = 5.87
MM1 pKa = 7.4ASLWRR6 pKa = 11.84RR7 pKa = 11.84ILPQRR12 pKa = 11.84VANSGSQLRR21 pKa = 11.84DD22 pKa = 3.2HH23 pKa = 6.56QANEE27 pKa = 3.99RR28 pKa = 11.84TFLSWTRR35 pKa = 11.84MGLGFAAMALALGRR49 pKa = 11.84LDD51 pKa = 4.6AIDD54 pKa = 5.07RR55 pKa = 11.84IISSGLSSSKK65 pKa = 11.14SNLLVVPDD73 pKa = 3.8NAGAGAAATAGRR85 pKa = 11.84SGNNINSTEE94 pKa = 3.9QQPNQISTYY103 pKa = 9.95LGSGLSAATLCQAISVWSFGYY124 pKa = 10.89GIFRR128 pKa = 11.84YY129 pKa = 10.16LSVRR133 pKa = 11.84RR134 pKa = 11.84NLLKK138 pKa = 10.92GQFTPAIWGPAFITCGCLGVFSSMGLWMEE167 pKa = 3.99RR168 pKa = 11.84RR169 pKa = 11.84DD170 pKa = 4.04KK171 pKa = 11.23KK172 pKa = 10.09MHH174 pKa = 5.87
Molecular weight: 18.84 kDa
Isoelectric point according different methods:
Peptides (in silico digests for buttom-up proteomics)
Below you can find in silico digests of the whole proteome with Trypsin, Chymotrypsin, Trypsin+LysC, LysN, ArgC proteases suitable for different mass spec machines.| Try ESI |
 |
|---|
| ChTry ESI |
 |
|---|
| ArgC ESI |
 |
|---|
| LysN ESI |
 |
|---|
| TryLysC ESI |
 |
|---|
| Try MALDI |
 |
|---|
| ChTry MALDI |
 |
|---|
| ArgC MALDI |
 |
|---|
| LysN MALDI |
 |
|---|
| TryLysC MALDI |
 |
|---|
| Try LTQ |
 |
|---|
| ChTry LTQ |
 |
|---|
| ArgC LTQ |
 |
|---|
| LysN LTQ |
 |
|---|
| TryLysC LTQ |
 |
|---|
| Try MSlow |
 |
|---|
| ChTry MSlow |
 |
|---|
| ArgC MSlow |
 |
|---|
| LysN MSlow |
 |
|---|
| TryLysC MSlow |
 |
|---|
| Try MShigh |
 |
|---|
| ChTry MShigh |
 |
|---|
| ArgC MShigh |
 |
|---|
| LysN MShigh |
 |
|---|
| TryLysC MShigh |
 |
|---|
General Statistics
Number of major isoforms |
Number of additional isoforms |
Number of all proteins |
Number of amino acids |
Min. Seq. Length |
Max. Seq. Length |
Avg. Seq. Length |
Avg. Mol. Weight |
|---|---|---|---|---|---|---|---|
0 |
5093457 |
66 |
6247 |
527.1 |
58.34 |
Amino acid frequency
Ala |
Cys |
Asp |
Glu |
Phe |
Gly |
His |
Ile |
Lys |
Leu |
|---|---|---|---|---|---|---|---|---|---|
8.715 ± 0.024 | 1.231 ± 0.009 |
5.617 ± 0.019 | 6.174 ± 0.026 |
3.72 ± 0.015 | 6.782 ± 0.022 |
2.388 ± 0.01 | 4.904 ± 0.016 |
4.599 ± 0.02 | 9.124 ± 0.024 |
Met |
Asn |
Gln |
Pro |
Arg |
Ser |
Thr |
Val |
Trp |
Tyr |
|---|---|---|---|---|---|---|---|---|---|
2.114 ± 0.009 | 3.607 ± 0.012 |
6.028 ± 0.027 | 4.031 ± 0.017 |
6.227 ± 0.02 | 8.304 ± 0.03 |
5.88 ± 0.018 | 6.247 ± 0.017 |
1.472 ± 0.01 | 2.837 ± 0.013 |
Most of the basic statistics you can see at this page can be downloaded from this CSV file
Proteome-pI is available under Creative Commons Attribution-NoDerivs license, for more details see here
| Reference: Kozlowski LP. Proteome-pI 2.0: Proteome Isoelectric Point Database Update. Nucleic Acids Res. 2021, doi: 10.1093/nar/gkab944 | Contact: Lukasz P. Kozlowski |
