Loveridges garter snake virus 1
Taxonomy: Viruses; Riboviria; Orthornavirae; Negarnaviricota; Haploviricotina; Monjiviricetes; Mononegavirales; Bornaviridae; Orthobornavirus; Elapid 1 orthobornavirus
Average proteome isoelectric point is 6.8
Get precalculated fractions of proteins

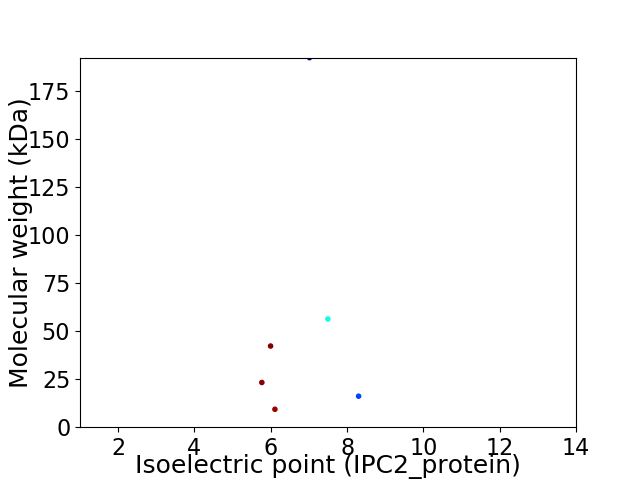
Virtual 2D-PAGE plot for 6 proteins (isoelectric point calculated using IPC2_protein)
Get csv file with sequences according to given criteria:
* You can choose from 21 different methods for calculating isoelectric point
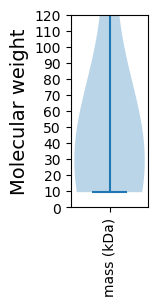
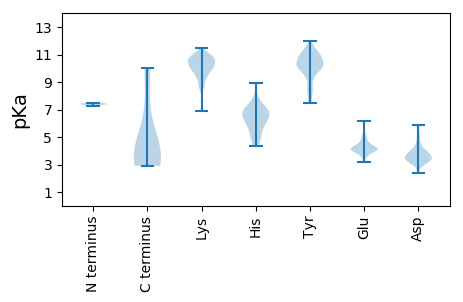
Summary statistics related to proteome-wise predictions


Protein with the lowest isoelectric point:
>tr|A0A077ETD9|A0A077ETD9_9MONO Phosphoprotein OS=Loveridges garter snake virus 1 OX=1881951 GN=P PE=4 SV=1
MM1 pKa = 7.26ATRR4 pKa = 11.84RR5 pKa = 11.84DD6 pKa = 3.79NLVSPLEE13 pKa = 4.16EE14 pKa = 5.05DD15 pKa = 4.13PPSTAHH21 pKa = 6.1RR22 pKa = 11.84TRR24 pKa = 11.84SRR26 pKa = 11.84SPIRR30 pKa = 11.84RR31 pKa = 11.84KK32 pKa = 10.11KK33 pKa = 10.85SLDD36 pKa = 3.21KK37 pKa = 10.92RR38 pKa = 11.84LLGYY42 pKa = 9.89SVEE45 pKa = 4.07EE46 pKa = 4.34LVDD49 pKa = 3.64KK50 pKa = 10.97MSVNPGLIYY59 pKa = 10.75DD60 pKa = 4.49KK61 pKa = 10.82EE62 pKa = 4.05QLATGRR68 pKa = 11.84EE69 pKa = 4.13ALSSEE74 pKa = 4.2EE75 pKa = 5.0LIKK78 pKa = 10.87QLMGEE83 pKa = 4.28IKK85 pKa = 9.6TATEE89 pKa = 3.63EE90 pKa = 3.98RR91 pKa = 11.84KK92 pKa = 9.38IDD94 pKa = 3.59QEE96 pKa = 4.37VIQMKK101 pKa = 10.06FSHH104 pKa = 6.92LEE106 pKa = 3.89RR107 pKa = 11.84TLEE110 pKa = 4.11SYY112 pKa = 10.8FEE114 pKa = 4.52SVVTTQVEE122 pKa = 4.15ILEE125 pKa = 4.47KK126 pKa = 10.61LGQLDD131 pKa = 3.73YY132 pKa = 11.33SGSIRR137 pKa = 11.84QLGEE141 pKa = 3.44NMKK144 pKa = 10.43ILDD147 pKa = 4.09KK148 pKa = 10.98SLKK151 pKa = 10.43AVTASVTLMTEE162 pKa = 4.01KK163 pKa = 10.8VDD165 pKa = 4.08LLYY168 pKa = 11.36GKK170 pKa = 8.97MAVGTSNAPMIPSCPQPQSIYY191 pKa = 10.14PKK193 pKa = 10.05LPEE196 pKa = 4.14STATAPALDD205 pKa = 3.38IVFF208 pKa = 4.28
MM1 pKa = 7.26ATRR4 pKa = 11.84RR5 pKa = 11.84DD6 pKa = 3.79NLVSPLEE13 pKa = 4.16EE14 pKa = 5.05DD15 pKa = 4.13PPSTAHH21 pKa = 6.1RR22 pKa = 11.84TRR24 pKa = 11.84SRR26 pKa = 11.84SPIRR30 pKa = 11.84RR31 pKa = 11.84KK32 pKa = 10.11KK33 pKa = 10.85SLDD36 pKa = 3.21KK37 pKa = 10.92RR38 pKa = 11.84LLGYY42 pKa = 9.89SVEE45 pKa = 4.07EE46 pKa = 4.34LVDD49 pKa = 3.64KK50 pKa = 10.97MSVNPGLIYY59 pKa = 10.75DD60 pKa = 4.49KK61 pKa = 10.82EE62 pKa = 4.05QLATGRR68 pKa = 11.84EE69 pKa = 4.13ALSSEE74 pKa = 4.2EE75 pKa = 5.0LIKK78 pKa = 10.87QLMGEE83 pKa = 4.28IKK85 pKa = 9.6TATEE89 pKa = 3.63EE90 pKa = 3.98RR91 pKa = 11.84KK92 pKa = 9.38IDD94 pKa = 3.59QEE96 pKa = 4.37VIQMKK101 pKa = 10.06FSHH104 pKa = 6.92LEE106 pKa = 3.89RR107 pKa = 11.84TLEE110 pKa = 4.11SYY112 pKa = 10.8FEE114 pKa = 4.52SVVTTQVEE122 pKa = 4.15ILEE125 pKa = 4.47KK126 pKa = 10.61LGQLDD131 pKa = 3.73YY132 pKa = 11.33SGSIRR137 pKa = 11.84QLGEE141 pKa = 3.44NMKK144 pKa = 10.43ILDD147 pKa = 4.09KK148 pKa = 10.98SLKK151 pKa = 10.43AVTASVTLMTEE162 pKa = 4.01KK163 pKa = 10.8VDD165 pKa = 4.08LLYY168 pKa = 11.36GKK170 pKa = 8.97MAVGTSNAPMIPSCPQPQSIYY191 pKa = 10.14PKK193 pKa = 10.05LPEE196 pKa = 4.14STATAPALDD205 pKa = 3.38IVFF208 pKa = 4.28
Molecular weight: 23.29 kDa
Isoelectric point according different methods:
Protein with the highest isoelectric point:
>tr|A0A077ETD9|A0A077ETD9_9MONO Phosphoprotein OS=Loveridges garter snake virus 1 OX=1881951 GN=P PE=4 SV=1
MM1 pKa = 7.48APKK4 pKa = 10.17HH5 pKa = 5.99EE6 pKa = 4.44YY7 pKa = 9.98IEE9 pKa = 5.28LKK11 pKa = 10.81DD12 pKa = 3.77KK13 pKa = 11.33VIVPGWKK20 pKa = 8.38TLMLEE25 pKa = 3.68IDD27 pKa = 4.08FVGGASRR34 pKa = 11.84NQFVNFPLLSVKK46 pKa = 10.68DD47 pKa = 3.94DD48 pKa = 3.59FRR50 pKa = 11.84LPRR53 pKa = 11.84EE54 pKa = 3.84KK55 pKa = 10.71RR56 pKa = 11.84LINYY60 pKa = 7.48LTVDD64 pKa = 4.45AEE66 pKa = 4.39PSGHH70 pKa = 6.04GSVNIYY76 pKa = 10.99LLFSDD81 pKa = 5.88FLVQTLNSISVYY93 pKa = 10.34KK94 pKa = 10.78DD95 pKa = 3.26PIKK98 pKa = 9.78QHH100 pKa = 5.18MYY102 pKa = 10.38VRR104 pKa = 11.84LTEE107 pKa = 4.22NQSKK111 pKa = 9.91HH112 pKa = 6.19AINAAFDD119 pKa = 3.43VHH121 pKa = 7.17SYY123 pKa = 10.54RR124 pKa = 11.84LRR126 pKa = 11.84NVGVGPLGPDD136 pKa = 2.9IRR138 pKa = 11.84ATSPP142 pKa = 2.9
MM1 pKa = 7.48APKK4 pKa = 10.17HH5 pKa = 5.99EE6 pKa = 4.44YY7 pKa = 9.98IEE9 pKa = 5.28LKK11 pKa = 10.81DD12 pKa = 3.77KK13 pKa = 11.33VIVPGWKK20 pKa = 8.38TLMLEE25 pKa = 3.68IDD27 pKa = 4.08FVGGASRR34 pKa = 11.84NQFVNFPLLSVKK46 pKa = 10.68DD47 pKa = 3.94DD48 pKa = 3.59FRR50 pKa = 11.84LPRR53 pKa = 11.84EE54 pKa = 3.84KK55 pKa = 10.71RR56 pKa = 11.84LINYY60 pKa = 7.48LTVDD64 pKa = 4.45AEE66 pKa = 4.39PSGHH70 pKa = 6.04GSVNIYY76 pKa = 10.99LLFSDD81 pKa = 5.88FLVQTLNSISVYY93 pKa = 10.34KK94 pKa = 10.78DD95 pKa = 3.26PIKK98 pKa = 9.78QHH100 pKa = 5.18MYY102 pKa = 10.38VRR104 pKa = 11.84LTEE107 pKa = 4.22NQSKK111 pKa = 9.91HH112 pKa = 6.19AINAAFDD119 pKa = 3.43VHH121 pKa = 7.17SYY123 pKa = 10.54RR124 pKa = 11.84LRR126 pKa = 11.84NVGVGPLGPDD136 pKa = 2.9IRR138 pKa = 11.84ATSPP142 pKa = 2.9
Molecular weight: 16.14 kDa
Isoelectric point according different methods:
Peptides (in silico digests for buttom-up proteomics)
Below you can find in silico digests of the whole proteome with Trypsin, Chymotrypsin, Trypsin+LysC, LysN, ArgC proteases suitable for different mass spec machines.| Try ESI |
 |
|---|
| ChTry ESI |
 |
|---|
| ArgC ESI |
 |
|---|
| LysN ESI |
 |
|---|
| TryLysC ESI |
 |
|---|
| Try MALDI |
 |
|---|
| ChTry MALDI |
 |
|---|
| ArgC MALDI |
 |
|---|
| LysN MALDI |
 |
|---|
| TryLysC MALDI |
 |
|---|
| Try LTQ |
 |
|---|
| ChTry LTQ |
 |
|---|
| ArgC LTQ |
 |
|---|
| LysN LTQ |
 |
|---|
| TryLysC LTQ |
 |
|---|
| Try MSlow |
 |
|---|
| ChTry MSlow |
 |
|---|
| ArgC MSlow |
 |
|---|
| LysN MSlow |
 |
|---|
| TryLysC MSlow |
 |
|---|
| Try MShigh |
 |
|---|
| ChTry MShigh |
 |
|---|
| ArgC MShigh |
 |
|---|
| LysN MShigh |
 |
|---|
| TryLysC MShigh |
 |
|---|
General Statistics
Number of major isoforms |
Number of additional isoforms |
Number of all proteins |
Number of amino acids |
Min. Seq. Length |
Max. Seq. Length |
Avg. Seq. Length |
Avg. Mol. Weight |
|---|---|---|---|---|---|---|---|
0 |
3028 |
89 |
1713 |
504.7 |
56.64 |
Amino acid frequency
Ala |
Cys |
Asp |
Glu |
Phe |
Gly |
His |
Ile |
Lys |
Leu |
|---|---|---|---|---|---|---|---|---|---|
6.209 ± 0.8 | 1.948 ± 0.527 |
5.02 ± 0.159 | 5.746 ± 0.826 |
3.732 ± 0.41 | 5.68 ± 0.538 |
2.048 ± 0.24 | 6.968 ± 0.574 |
5.35 ± 0.342 | 10.766 ± 0.521 |
Met |
Asn |
Gln |
Pro |
Arg |
Ser |
Thr |
Val |
Trp |
Tyr |
|---|---|---|---|---|---|---|---|---|---|
2.543 ± 0.272 | 3.666 ± 0.77 |
5.218 ± 0.299 | 3.369 ± 0.4 |
5.68 ± 0.307 | 8.818 ± 0.611 |
6.011 ± 0.427 | 6.341 ± 0.631 |
1.387 ± 0.322 | 3.501 ± 0.405 |
Most of the basic statistics you can see at this page can be downloaded from this CSV file
Proteome-pI is available under Creative Commons Attribution-NoDerivs license, for more details see here
| Reference: Kozlowski LP. Proteome-pI 2.0: Proteome Isoelectric Point Database Update. Nucleic Acids Res. 2021, doi: 10.1093/nar/gkab944 | Contact: Lukasz P. Kozlowski |
