Candidatus Micrarchaeum acidiphilum ARMAN-2
Taxonomy: cellular organisms; Archaea; DPANN group; Candidatus Micrarchaeota; Candidatus Micrarchaeum; Candidatus Micrarchaeum acidiphilum
Average proteome isoelectric point is 7.29
Get precalculated fractions of proteins

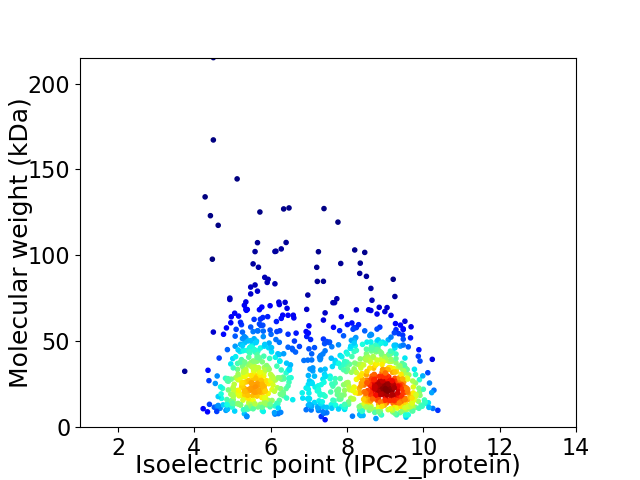
Virtual 2D-PAGE plot for 1025 proteins (isoelectric point calculated using IPC2_protein)
Get csv file with sequences according to given criteria:
* You can choose from 21 different methods for calculating isoelectric point
Summary statistics related to proteome-wise predictions


Protein with the lowest isoelectric point:
>tr|C7DGU6|C7DGU6_MICA2 Uncharacterized protein OS=Candidatus Micrarchaeum acidiphilum ARMAN-2 OX=425595 GN=UNLARM2_0296 PE=4 SV=1
MM1 pKa = 7.49KK2 pKa = 10.17AYY4 pKa = 9.68IYY6 pKa = 10.95GSMIAVGLAIGIFGAVLMLGFGFAQGTGTVTANVAVGNVIYY47 pKa = 10.37LAISPNSIVISGLAPNSIYY66 pKa = 8.58PTNIPVTDD74 pKa = 3.74TDD76 pKa = 3.32NGGNIGANALVEE88 pKa = 4.13GTNWVNQTYY97 pKa = 8.22TFGVSNTLEE106 pKa = 4.39SNTASATTLSGTPLSNSFAVTNSYY130 pKa = 10.4IIAPNVVNPSTNTIIYY146 pKa = 9.23FGFSIPPATPAGNYY160 pKa = 8.69LQTISFEE167 pKa = 4.24NEE169 pKa = 3.47NVSNRR174 pKa = 11.84EE175 pKa = 3.51FNAISTSNSVTITANVIGTCYY196 pKa = 10.25ISLSPNSIDD205 pKa = 5.21FGTLTPSANVPTNVGVNDD223 pKa = 3.69IDD225 pKa = 3.82NGGNVAAQLFVYY237 pKa = 9.52GGNWIGPANFEE248 pKa = 4.3VSNTTWSAASGTSFGTAARR267 pKa = 11.84LTGAANDD274 pKa = 3.98TNIVIPAPTPSNAVTSNSIYY294 pKa = 10.29FGLGIPPGTPAGTYY308 pKa = 9.45LQTITIEE315 pKa = 4.19NSCC318 pKa = 4.15
MM1 pKa = 7.49KK2 pKa = 10.17AYY4 pKa = 9.68IYY6 pKa = 10.95GSMIAVGLAIGIFGAVLMLGFGFAQGTGTVTANVAVGNVIYY47 pKa = 10.37LAISPNSIVISGLAPNSIYY66 pKa = 8.58PTNIPVTDD74 pKa = 3.74TDD76 pKa = 3.32NGGNIGANALVEE88 pKa = 4.13GTNWVNQTYY97 pKa = 8.22TFGVSNTLEE106 pKa = 4.39SNTASATTLSGTPLSNSFAVTNSYY130 pKa = 10.4IIAPNVVNPSTNTIIYY146 pKa = 9.23FGFSIPPATPAGNYY160 pKa = 8.69LQTISFEE167 pKa = 4.24NEE169 pKa = 3.47NVSNRR174 pKa = 11.84EE175 pKa = 3.51FNAISTSNSVTITANVIGTCYY196 pKa = 10.25ISLSPNSIDD205 pKa = 5.21FGTLTPSANVPTNVGVNDD223 pKa = 3.69IDD225 pKa = 3.82NGGNVAAQLFVYY237 pKa = 9.52GGNWIGPANFEE248 pKa = 4.3VSNTTWSAASGTSFGTAARR267 pKa = 11.84LTGAANDD274 pKa = 3.98TNIVIPAPTPSNAVTSNSIYY294 pKa = 10.29FGLGIPPGTPAGTYY308 pKa = 9.45LQTITIEE315 pKa = 4.19NSCC318 pKa = 4.15
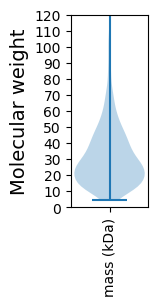
Molecular weight: 32.53 kDa
Isoelectric point according different methods:
Protein with the highest isoelectric point:
>tr|C7DGN4|C7DGN4_MICA2 DNA polymerase II large subunit OS=Candidatus Micrarchaeum acidiphilum ARMAN-2 OX=425595 GN=polC PE=3 SV=1
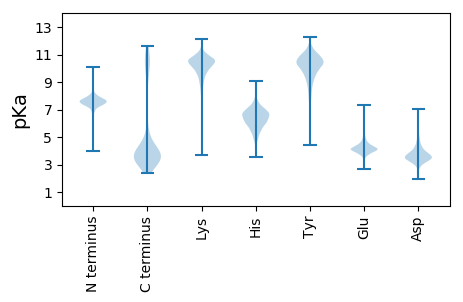
MM1 pKa = 8.0RR2 pKa = 11.84EE3 pKa = 3.68NKK5 pKa = 9.41LRR7 pKa = 11.84RR8 pKa = 11.84SSNRR12 pKa = 11.84QILATLEE19 pKa = 4.57GYY21 pKa = 10.76GLTEE25 pKa = 4.08FQTAVLKK32 pKa = 9.83ATLSIPKK39 pKa = 10.34GEE41 pKa = 4.01TRR43 pKa = 11.84TYY45 pKa = 10.25KK46 pKa = 10.57QIASLVGRR54 pKa = 11.84PRR56 pKa = 11.84AYY58 pKa = 10.08RR59 pKa = 11.84AVGTALKK66 pKa = 10.43NNPLPIIIPCHH77 pKa = 4.97RR78 pKa = 11.84VIRR81 pKa = 11.84SDD83 pKa = 4.29GEE85 pKa = 4.07TGNYY89 pKa = 9.94NGTGRR94 pKa = 11.84SGRR97 pKa = 11.84LKK99 pKa = 10.46KK100 pKa = 10.38IKK102 pKa = 9.61LLKK105 pKa = 10.06MEE107 pKa = 4.58GALL110 pKa = 4.29
MM1 pKa = 8.0RR2 pKa = 11.84EE3 pKa = 3.68NKK5 pKa = 9.41LRR7 pKa = 11.84RR8 pKa = 11.84SSNRR12 pKa = 11.84QILATLEE19 pKa = 4.57GYY21 pKa = 10.76GLTEE25 pKa = 4.08FQTAVLKK32 pKa = 9.83ATLSIPKK39 pKa = 10.34GEE41 pKa = 4.01TRR43 pKa = 11.84TYY45 pKa = 10.25KK46 pKa = 10.57QIASLVGRR54 pKa = 11.84PRR56 pKa = 11.84AYY58 pKa = 10.08RR59 pKa = 11.84AVGTALKK66 pKa = 10.43NNPLPIIIPCHH77 pKa = 4.97RR78 pKa = 11.84VIRR81 pKa = 11.84SDD83 pKa = 4.29GEE85 pKa = 4.07TGNYY89 pKa = 9.94NGTGRR94 pKa = 11.84SGRR97 pKa = 11.84LKK99 pKa = 10.46KK100 pKa = 10.38IKK102 pKa = 9.61LLKK105 pKa = 10.06MEE107 pKa = 4.58GALL110 pKa = 4.29
Molecular weight: 12.19 kDa
Isoelectric point according different methods:
Peptides (in silico digests for buttom-up proteomics)
Below you can find in silico digests of the whole proteome with Trypsin, Chymotrypsin, Trypsin+LysC, LysN, ArgC proteases suitable for different mass spec machines.| Try ESI |
 |
|---|
| ChTry ESI |
 |
|---|
| ArgC ESI |
 |
|---|
| LysN ESI |
 |
|---|
| TryLysC ESI |
 |
|---|
| Try MALDI |
 |
|---|
| ChTry MALDI |
 |
|---|
| ArgC MALDI |
 |
|---|
| LysN MALDI |
 |
|---|
| TryLysC MALDI |
 |
|---|
| Try LTQ |
 |
|---|
| ChTry LTQ |
 |
|---|
| ArgC LTQ |
 |
|---|
| LysN LTQ |
 |
|---|
| TryLysC LTQ |
 |
|---|
| Try MSlow |
 |
|---|
| ChTry MSlow |
 |
|---|
| ArgC MSlow |
 |
|---|
| LysN MSlow |
 |
|---|
| TryLysC MSlow |
 |
|---|
| Try MShigh |
 |
|---|
| ChTry MShigh |
 |
|---|
| ArgC MShigh |
 |
|---|
| LysN MShigh |
 |
|---|
| TryLysC MShigh |
 |
|---|
General Statistics
Number of major isoforms |
Number of additional isoforms |
Number of all proteins |
Number of amino acids |
Min. Seq. Length |
Max. Seq. Length |
Avg. Seq. Length |
Avg. Mol. Weight |
|---|---|---|---|---|---|---|---|
0 |
303770 |
38 |
2034 |
296.4 |
32.82 |
Amino acid frequency
Ala |
Cys |
Asp |
Glu |
Phe |
Gly |
His |
Ile |
Lys |
Leu |
|---|---|---|---|---|---|---|---|---|---|
8.431 ± 0.074 | 0.79 ± 0.031 |
4.719 ± 0.079 | 6.141 ± 0.115 |
4.309 ± 0.064 | 7.449 ± 0.077 |
1.475 ± 0.028 | 8.126 ± 0.075 |
7.296 ± 0.114 | 8.806 ± 0.092 |
Met |
Asn |
Gln |
Pro |
Arg |
Ser |
Thr |
Val |
Trp |
Tyr |
|---|---|---|---|---|---|---|---|---|---|
2.811 ± 0.038 | 4.663 ± 0.082 |
3.624 ± 0.052 | 2.413 ± 0.04 |
4.613 ± 0.081 | 7.885 ± 0.101 |
4.952 ± 0.118 | 6.631 ± 0.06 |
0.725 ± 0.023 | 4.14 ± 0.06 |
Most of the basic statistics you can see at this page can be downloaded from this CSV file
Proteome-pI is available under Creative Commons Attribution-NoDerivs license, for more details see here
| Reference: Kozlowski LP. Proteome-pI 2.0: Proteome Isoelectric Point Database Update. Nucleic Acids Res. 2021, doi: 10.1093/nar/gkab944 | Contact: Lukasz P. Kozlowski |
