Brevibacterium linens
Taxonomy: cellular organisms; Bacteria; Terrabacteria group; Actinobacteria; Actinomycetia; Micrococcales; Brevibacteriaceae; Brevibacterium
Average proteome isoelectric point is 5.73
Get precalculated fractions of proteins

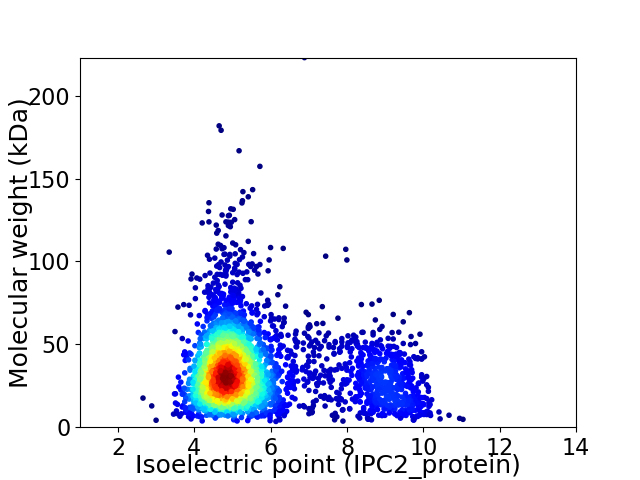
Virtual 2D-PAGE plot for 3434 proteins (isoelectric point calculated using IPC2_protein)
Get csv file with sequences according to given criteria:
* You can choose from 21 different methods for calculating isoelectric point
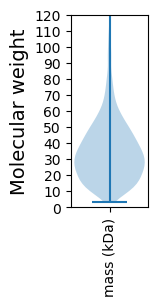
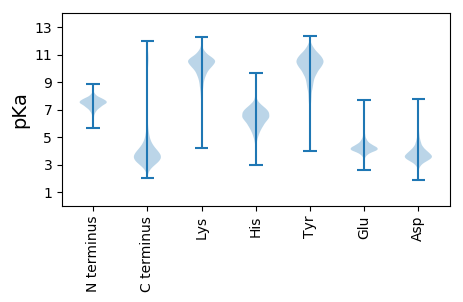
Summary statistics related to proteome-wise predictions


Protein with the lowest isoelectric point:
>tr|A0A0B8ZX26|A0A0B8ZX26_BRELN Glyoxalase-like domain containing protein OS=Brevibacterium linens OX=1703 GN=AE0388_2888 PE=4 SV=1
MM1 pKa = 7.76RR2 pKa = 11.84FGAFVVALADD12 pKa = 3.74SVYY15 pKa = 10.11SEE17 pKa = 4.44SMRR20 pKa = 11.84LPLSSIPPRR29 pKa = 11.84WMATAAALGVAVAMSGCSTNEE50 pKa = 3.55ASLTMPVSGTFDD62 pKa = 3.45YY63 pKa = 11.28QLGGTYY69 pKa = 10.45DD70 pKa = 3.84SLPCSVGPSSSVDD83 pKa = 3.41DD84 pKa = 5.28PIDD87 pKa = 3.32IVVRR91 pKa = 11.84DD92 pKa = 4.25AGAAPLTGAYY102 pKa = 8.97SVCYY106 pKa = 10.59VNGFQTQPDD115 pKa = 4.35EE116 pKa = 4.09ATLWRR121 pKa = 11.84DD122 pKa = 2.95HH123 pKa = 7.74DD124 pKa = 4.9DD125 pKa = 4.81LLLHH129 pKa = 6.97DD130 pKa = 5.49ADD132 pKa = 4.74GEE134 pKa = 4.61LVVDD138 pKa = 4.53PDD140 pKa = 3.59WPDD143 pKa = 3.18EE144 pKa = 4.72HH145 pKa = 8.73ILDD148 pKa = 4.53PSTADD153 pKa = 3.33RR154 pKa = 11.84RR155 pKa = 11.84SEE157 pKa = 3.68ILDD160 pKa = 3.56IIGPVIDD167 pKa = 4.52GCASSGFDD175 pKa = 4.08AVEE178 pKa = 3.84IDD180 pKa = 4.3NLDD183 pKa = 3.58TADD186 pKa = 4.47RR187 pKa = 11.84FPDD190 pKa = 3.28IDD192 pKa = 3.53RR193 pKa = 11.84TGALDD198 pKa = 3.99LAAEE202 pKa = 4.44YY203 pKa = 10.82VDD205 pKa = 4.16RR206 pKa = 11.84AHH208 pKa = 7.12AQGLSIAQKK217 pKa = 10.26NAAEE221 pKa = 4.16LAEE224 pKa = 4.34TAHH227 pKa = 6.19SQLSFDD233 pKa = 3.81FAVTEE238 pKa = 4.0EE239 pKa = 4.33CVAFDD244 pKa = 3.19EE245 pKa = 4.82CDD247 pKa = 3.1RR248 pKa = 11.84FTSVYY253 pKa = 9.59GDD255 pKa = 3.47CVLAIEE261 pKa = 4.63YY262 pKa = 9.72PDD264 pKa = 3.69TLVEE268 pKa = 4.51AGLDD272 pKa = 3.63FADD275 pKa = 4.09ACTVPDD281 pKa = 4.82RR282 pKa = 11.84PPLMILRR289 pKa = 11.84DD290 pKa = 3.95RR291 pKa = 11.84DD292 pKa = 3.42LVAAGDD298 pKa = 3.56PGYY301 pKa = 10.96RR302 pKa = 11.84FDD304 pKa = 3.65TCC306 pKa = 5.25
MM1 pKa = 7.76RR2 pKa = 11.84FGAFVVALADD12 pKa = 3.74SVYY15 pKa = 10.11SEE17 pKa = 4.44SMRR20 pKa = 11.84LPLSSIPPRR29 pKa = 11.84WMATAAALGVAVAMSGCSTNEE50 pKa = 3.55ASLTMPVSGTFDD62 pKa = 3.45YY63 pKa = 11.28QLGGTYY69 pKa = 10.45DD70 pKa = 3.84SLPCSVGPSSSVDD83 pKa = 3.41DD84 pKa = 5.28PIDD87 pKa = 3.32IVVRR91 pKa = 11.84DD92 pKa = 4.25AGAAPLTGAYY102 pKa = 8.97SVCYY106 pKa = 10.59VNGFQTQPDD115 pKa = 4.35EE116 pKa = 4.09ATLWRR121 pKa = 11.84DD122 pKa = 2.95HH123 pKa = 7.74DD124 pKa = 4.9DD125 pKa = 4.81LLLHH129 pKa = 6.97DD130 pKa = 5.49ADD132 pKa = 4.74GEE134 pKa = 4.61LVVDD138 pKa = 4.53PDD140 pKa = 3.59WPDD143 pKa = 3.18EE144 pKa = 4.72HH145 pKa = 8.73ILDD148 pKa = 4.53PSTADD153 pKa = 3.33RR154 pKa = 11.84RR155 pKa = 11.84SEE157 pKa = 3.68ILDD160 pKa = 3.56IIGPVIDD167 pKa = 4.52GCASSGFDD175 pKa = 4.08AVEE178 pKa = 3.84IDD180 pKa = 4.3NLDD183 pKa = 3.58TADD186 pKa = 4.47RR187 pKa = 11.84FPDD190 pKa = 3.28IDD192 pKa = 3.53RR193 pKa = 11.84TGALDD198 pKa = 3.99LAAEE202 pKa = 4.44YY203 pKa = 10.82VDD205 pKa = 4.16RR206 pKa = 11.84AHH208 pKa = 7.12AQGLSIAQKK217 pKa = 10.26NAAEE221 pKa = 4.16LAEE224 pKa = 4.34TAHH227 pKa = 6.19SQLSFDD233 pKa = 3.81FAVTEE238 pKa = 4.0EE239 pKa = 4.33CVAFDD244 pKa = 3.19EE245 pKa = 4.82CDD247 pKa = 3.1RR248 pKa = 11.84FTSVYY253 pKa = 9.59GDD255 pKa = 3.47CVLAIEE261 pKa = 4.63YY262 pKa = 9.72PDD264 pKa = 3.69TLVEE268 pKa = 4.51AGLDD272 pKa = 3.63FADD275 pKa = 4.09ACTVPDD281 pKa = 4.82RR282 pKa = 11.84PPLMILRR289 pKa = 11.84DD290 pKa = 3.95RR291 pKa = 11.84DD292 pKa = 3.42LVAAGDD298 pKa = 3.56PGYY301 pKa = 10.96RR302 pKa = 11.84FDD304 pKa = 3.65TCC306 pKa = 5.25
Molecular weight: 32.76 kDa
Isoelectric point according different methods:
Protein with the highest isoelectric point:
>tr|A0A0B8ZXN5|A0A0B8ZXN5_BRELN Uncharacterized protein OS=Brevibacterium linens OX=1703 GN=AE0388_3108 PE=4 SV=1
MM1 pKa = 7.69SKK3 pKa = 9.0RR4 pKa = 11.84TFQPNNRR11 pKa = 11.84KK12 pKa = 8.99RR13 pKa = 11.84AKK15 pKa = 9.77KK16 pKa = 9.51HH17 pKa = 4.17GFRR20 pKa = 11.84LRR22 pKa = 11.84MRR24 pKa = 11.84TRR26 pKa = 11.84AGRR29 pKa = 11.84SILAARR35 pKa = 11.84RR36 pKa = 11.84RR37 pKa = 11.84KK38 pKa = 9.65GRR40 pKa = 11.84SDD42 pKa = 2.92ISAA45 pKa = 3.67
MM1 pKa = 7.69SKK3 pKa = 9.0RR4 pKa = 11.84TFQPNNRR11 pKa = 11.84KK12 pKa = 8.99RR13 pKa = 11.84AKK15 pKa = 9.77KK16 pKa = 9.51HH17 pKa = 4.17GFRR20 pKa = 11.84LRR22 pKa = 11.84MRR24 pKa = 11.84TRR26 pKa = 11.84AGRR29 pKa = 11.84SILAARR35 pKa = 11.84RR36 pKa = 11.84RR37 pKa = 11.84KK38 pKa = 9.65GRR40 pKa = 11.84SDD42 pKa = 2.92ISAA45 pKa = 3.67
Molecular weight: 5.33 kDa
Isoelectric point according different methods:
Peptides (in silico digests for buttom-up proteomics)
Below you can find in silico digests of the whole proteome with Trypsin, Chymotrypsin, Trypsin+LysC, LysN, ArgC proteases suitable for different mass spec machines.| Try ESI |
 |
|---|
| ChTry ESI |
 |
|---|
| ArgC ESI |
 |
|---|
| LysN ESI |
 |
|---|
| TryLysC ESI |
 |
|---|
| Try MALDI |
 |
|---|
| ChTry MALDI |
 |
|---|
| ArgC MALDI |
 |
|---|
| LysN MALDI |
 |
|---|
| TryLysC MALDI |
 |
|---|
| Try LTQ |
 |
|---|
| ChTry LTQ |
 |
|---|
| ArgC LTQ |
 |
|---|
| LysN LTQ |
 |
|---|
| TryLysC LTQ |
 |
|---|
| Try MSlow |
 |
|---|
| ChTry MSlow |
 |
|---|
| ArgC MSlow |
 |
|---|
| LysN MSlow |
 |
|---|
| TryLysC MSlow |
 |
|---|
| Try MShigh |
 |
|---|
| ChTry MShigh |
 |
|---|
| ArgC MShigh |
 |
|---|
| LysN MShigh |
 |
|---|
| TryLysC MShigh |
 |
|---|
General Statistics
Number of major isoforms |
Number of additional isoforms |
Number of all proteins |
Number of amino acids |
Min. Seq. Length |
Max. Seq. Length |
Avg. Seq. Length |
Avg. Mol. Weight |
|---|---|---|---|---|---|---|---|
0 |
1150451 |
33 |
2097 |
335.0 |
35.99 |
Amino acid frequency
Ala |
Cys |
Asp |
Glu |
Phe |
Gly |
His |
Ile |
Lys |
Leu |
|---|---|---|---|---|---|---|---|---|---|
12.103 ± 0.048 | 0.614 ± 0.011 |
6.502 ± 0.048 | 6.247 ± 0.043 |
3.406 ± 0.029 | 8.795 ± 0.038 |
2.042 ± 0.021 | 5.133 ± 0.036 |
2.896 ± 0.036 | 9.621 ± 0.043 |
Met |
Asn |
Gln |
Pro |
Arg |
Ser |
Thr |
Val |
Trp |
Tyr |
|---|---|---|---|---|---|---|---|---|---|
2.066 ± 0.018 | 2.37 ± 0.02 |
5.08 ± 0.025 | 2.841 ± 0.026 |
6.275 ± 0.045 | 6.436 ± 0.034 |
6.223 ± 0.026 | 8.089 ± 0.038 |
1.351 ± 0.018 | 1.911 ± 0.018 |
Most of the basic statistics you can see at this page can be downloaded from this CSV file
Proteome-pI is available under Creative Commons Attribution-NoDerivs license, for more details see here
| Reference: Kozlowski LP. Proteome-pI 2.0: Proteome Isoelectric Point Database Update. Nucleic Acids Res. 2021, doi: 10.1093/nar/gkab944 | Contact: Lukasz P. Kozlowski |
