CRESS virus sp. ct0Vt4
Taxonomy: Viruses; Monodnaviria; Shotokuvirae; Cressdnaviricota; unclassified Cressdnaviricota; CRESS viruses
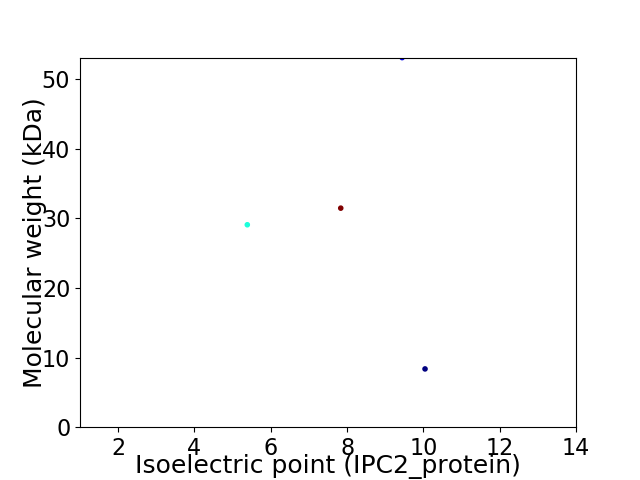
Average proteome isoelectric point is 7.84
Get precalculated fractions of proteins

Virtual 2D-PAGE plot for 4 proteins (isoelectric point calculated using IPC2_protein)
Get csv file with sequences according to given criteria:
* You can choose from 21 different methods for calculating isoelectric point
Summary statistics related to proteome-wise predictions


Protein with the lowest isoelectric point:
>tr|A0A5Q2WC63|A0A5Q2WC63_9VIRU Uncharacterized protein OS=CRESS virus sp. ct0Vt4 OX=2656673 PE=4 SV=1
MM1 pKa = 7.84PCHH4 pKa = 6.52PLLSRR9 pKa = 11.84EE10 pKa = 4.19DD11 pKa = 3.67TGFSPYY17 pKa = 10.41HH18 pKa = 5.32NTSIHH23 pKa = 5.5HH24 pKa = 6.43TSPATAYY31 pKa = 10.28GFEE34 pKa = 4.54ANWNEE39 pKa = 4.04EE40 pKa = 3.58NRR42 pKa = 11.84QNMSIGNWSSASSLRR57 pKa = 11.84LDD59 pKa = 4.61SEE61 pKa = 4.2EE62 pKa = 5.05LDD64 pKa = 4.21PFSAMYY70 pKa = 9.28TPNSVDD76 pKa = 3.25QQLPTTTSGNRR87 pKa = 11.84TLMLTEE93 pKa = 5.74HH94 pKa = 7.17DD95 pKa = 5.08LNWDD99 pKa = 3.44NDD101 pKa = 3.87QLPEE105 pKa = 3.94IQRR108 pKa = 11.84LTGTLYY114 pKa = 11.08GNQPSPEE121 pKa = 4.08TLRR124 pKa = 11.84PFPALYY130 pKa = 9.98EE131 pKa = 4.12YY132 pKa = 11.19LHH134 pKa = 6.38TPQSVVSRR142 pKa = 11.84RR143 pKa = 11.84TTLSPSPWNDD153 pKa = 2.84TFQSMWDD160 pKa = 3.71LLALASHH167 pKa = 6.62EE168 pKa = 4.25EE169 pKa = 3.86HH170 pKa = 6.76GQRR173 pKa = 11.84QDD175 pKa = 3.23LMPIPRR181 pKa = 11.84TQIPSSGMGIRR192 pKa = 11.84ARR194 pKa = 11.84RR195 pKa = 11.84TSSWTNSEE203 pKa = 3.92ARR205 pKa = 11.84STFPTYY211 pKa = 10.96SDD213 pKa = 3.72GQIDD217 pKa = 4.32TPCPLRR223 pKa = 11.84QRR225 pKa = 11.84EE226 pKa = 3.73VDD228 pKa = 3.75AFSALQSFGSPAICTQCHH246 pKa = 7.19GIPISTPKK254 pKa = 10.46RR255 pKa = 11.84KK256 pKa = 7.33THH258 pKa = 5.78
MM1 pKa = 7.84PCHH4 pKa = 6.52PLLSRR9 pKa = 11.84EE10 pKa = 4.19DD11 pKa = 3.67TGFSPYY17 pKa = 10.41HH18 pKa = 5.32NTSIHH23 pKa = 5.5HH24 pKa = 6.43TSPATAYY31 pKa = 10.28GFEE34 pKa = 4.54ANWNEE39 pKa = 4.04EE40 pKa = 3.58NRR42 pKa = 11.84QNMSIGNWSSASSLRR57 pKa = 11.84LDD59 pKa = 4.61SEE61 pKa = 4.2EE62 pKa = 5.05LDD64 pKa = 4.21PFSAMYY70 pKa = 9.28TPNSVDD76 pKa = 3.25QQLPTTTSGNRR87 pKa = 11.84TLMLTEE93 pKa = 5.74HH94 pKa = 7.17DD95 pKa = 5.08LNWDD99 pKa = 3.44NDD101 pKa = 3.87QLPEE105 pKa = 3.94IQRR108 pKa = 11.84LTGTLYY114 pKa = 11.08GNQPSPEE121 pKa = 4.08TLRR124 pKa = 11.84PFPALYY130 pKa = 9.98EE131 pKa = 4.12YY132 pKa = 11.19LHH134 pKa = 6.38TPQSVVSRR142 pKa = 11.84RR143 pKa = 11.84TTLSPSPWNDD153 pKa = 2.84TFQSMWDD160 pKa = 3.71LLALASHH167 pKa = 6.62EE168 pKa = 4.25EE169 pKa = 3.86HH170 pKa = 6.76GQRR173 pKa = 11.84QDD175 pKa = 3.23LMPIPRR181 pKa = 11.84TQIPSSGMGIRR192 pKa = 11.84ARR194 pKa = 11.84RR195 pKa = 11.84TSSWTNSEE203 pKa = 3.92ARR205 pKa = 11.84STFPTYY211 pKa = 10.96SDD213 pKa = 3.72GQIDD217 pKa = 4.32TPCPLRR223 pKa = 11.84QRR225 pKa = 11.84EE226 pKa = 3.73VDD228 pKa = 3.75AFSALQSFGSPAICTQCHH246 pKa = 7.19GIPISTPKK254 pKa = 10.46RR255 pKa = 11.84KK256 pKa = 7.33THH258 pKa = 5.78
Molecular weight: 29.06 kDa
Isoelectric point according different methods:
Protein with the highest isoelectric point:
>tr|A0A5Q2WB21|A0A5Q2WB21_9VIRU Putative capsid protein OS=CRESS virus sp. ct0Vt4 OX=2656673 PE=4 SV=1
MM1 pKa = 7.16TVNLSLLLRR10 pKa = 11.84CISCKK15 pKa = 10.11INLLRR20 pKa = 11.84VLGQRR25 pKa = 11.84LVLPTSSWKK34 pKa = 10.52RR35 pKa = 11.84LTCLGRR41 pKa = 11.84RR42 pKa = 11.84AEE44 pKa = 3.99RR45 pKa = 11.84LARR48 pKa = 11.84KK49 pKa = 9.97DD50 pKa = 3.16IVLGLSTNKK59 pKa = 8.67TRR61 pKa = 11.84TTGLVFIFNFIYY73 pKa = 10.6
MM1 pKa = 7.16TVNLSLLLRR10 pKa = 11.84CISCKK15 pKa = 10.11INLLRR20 pKa = 11.84VLGQRR25 pKa = 11.84LVLPTSSWKK34 pKa = 10.52RR35 pKa = 11.84LTCLGRR41 pKa = 11.84RR42 pKa = 11.84AEE44 pKa = 3.99RR45 pKa = 11.84LARR48 pKa = 11.84KK49 pKa = 9.97DD50 pKa = 3.16IVLGLSTNKK59 pKa = 8.67TRR61 pKa = 11.84TTGLVFIFNFIYY73 pKa = 10.6
Molecular weight: 8.37 kDa
Isoelectric point according different methods:
Peptides (in silico digests for buttom-up proteomics)
Below you can find in silico digests of the whole proteome with Trypsin, Chymotrypsin, Trypsin+LysC, LysN, ArgC proteases suitable for different mass spec machines.| Try ESI |
 |
|---|
| ChTry ESI |
 |
|---|
| ArgC ESI |
 |
|---|
| LysN ESI |
 |
|---|
| TryLysC ESI |
 |
|---|
| Try MALDI |
 |
|---|
| ChTry MALDI |
 |
|---|
| ArgC MALDI |
 |
|---|
| LysN MALDI |
 |
|---|
| TryLysC MALDI |
 |
|---|
| Try LTQ |
 |
|---|
| ChTry LTQ |
 |
|---|
| ArgC LTQ |
 |
|---|
| LysN LTQ |
 |
|---|
| TryLysC LTQ |
 |
|---|
| Try MSlow |
 |
|---|
| ChTry MSlow |
 |
|---|
| ArgC MSlow |
 |
|---|
| LysN MSlow |
 |
|---|
| TryLysC MSlow |
 |
|---|
| Try MShigh |
 |
|---|
| ChTry MShigh |
 |
|---|
| ArgC MShigh |
 |
|---|
| LysN MShigh |
 |
|---|
| TryLysC MShigh |
 |
|---|
General Statistics
Number of major isoforms |
Number of additional isoforms |
Number of all proteins |
Number of amino acids |
Min. Seq. Length |
Max. Seq. Length |
Avg. Seq. Length |
Avg. Mol. Weight |
|---|---|---|---|---|---|---|---|
0 |
1076 |
73 |
471 |
269.0 |
30.48 |
Amino acid frequency
Ala |
Cys |
Asp |
Glu |
Phe |
Gly |
His |
Ile |
Lys |
Leu |
|---|---|---|---|---|---|---|---|---|---|
6.134 ± 0.593 | 1.115 ± 0.401 |
4.461 ± 0.647 | 4.647 ± 0.375 |
3.81 ± 0.443 | 6.506 ± 0.603 |
2.323 ± 0.494 | 4.647 ± 0.293 |
6.041 ± 1.816 | 7.807 ± 1.38 |
Met |
Asn |
Gln |
Pro |
Arg |
Ser |
Thr |
Val |
Trp |
Tyr |
|---|---|---|---|---|---|---|---|---|---|
2.509 ± 0.177 | 5.019 ± 0.724 |
5.576 ± 1.077 | 3.81 ± 0.623 |
6.784 ± 0.609 | 8.178 ± 1.223 |
8.086 ± 0.813 | 6.227 ± 1.419 |
2.509 ± 0.485 | 3.81 ± 0.582 |
Most of the basic statistics you can see at this page can be downloaded from this CSV file
Proteome-pI is available under Creative Commons Attribution-NoDerivs license, for more details see here
| Reference: Kozlowski LP. Proteome-pI 2.0: Proteome Isoelectric Point Database Update. Nucleic Acids Res. 2021, doi: 10.1093/nar/gkab944 | Contact: Lukasz P. Kozlowski |
