Sphingomonas guangdongensis
Taxonomy: cellular organisms; Bacteria; Proteobacteria; Alphaproteobacteria; Sphingomonadales; Sphingomonadaceae; Sphingomonas
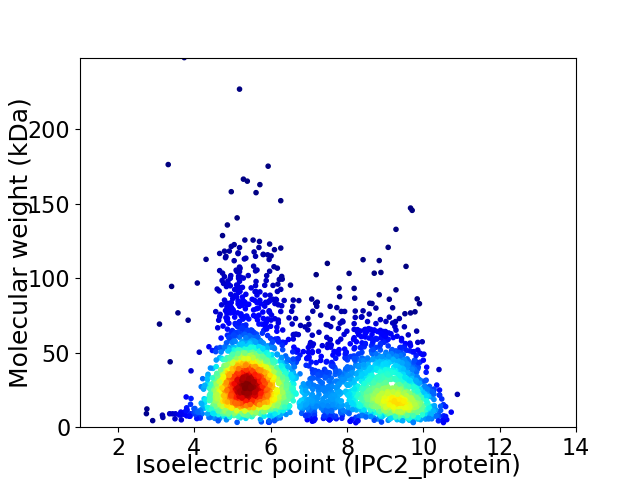
Average proteome isoelectric point is 6.8
Get precalculated fractions of proteins

Virtual 2D-PAGE plot for 3454 proteins (isoelectric point calculated using IPC2_protein)
Get csv file with sequences according to given criteria:
* You can choose from 21 different methods for calculating isoelectric point
Summary statistics related to proteome-wise predictions


Protein with the lowest isoelectric point:
>tr|A0A285QYB7|A0A285QYB7_9SPHN Outer membrane protein adhesin transport system OS=Sphingomonas guangdongensis OX=1141890 GN=SAMN06297144_1932 PE=3 SV=1
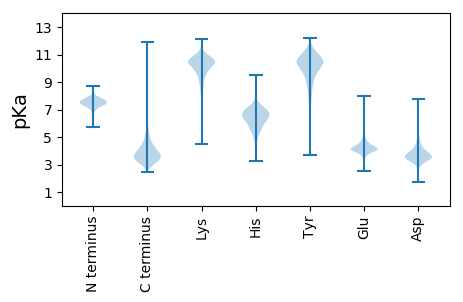
MM1 pKa = 7.63PNDD4 pKa = 3.34HH5 pKa = 7.13EE6 pKa = 4.61YY7 pKa = 11.46AFDD10 pKa = 3.66SYY12 pKa = 11.55GDD14 pKa = 4.1EE15 pKa = 4.11EE16 pKa = 5.58SEE18 pKa = 4.19PQDD21 pKa = 4.86ASDD24 pKa = 5.03FDD26 pKa = 6.11DD27 pKa = 4.67GDD29 pKa = 4.52AYY31 pKa = 11.1DD32 pKa = 5.49DD33 pKa = 4.23ADD35 pKa = 4.09ADD37 pKa = 4.0EE38 pKa = 4.88EE39 pKa = 4.46DD40 pKa = 4.27RR41 pKa = 11.84TDD43 pKa = 3.83LGPDD47 pKa = 3.34GVVRR51 pKa = 11.84CDD53 pKa = 3.53FRR55 pKa = 11.84DD56 pKa = 3.7ANGEE60 pKa = 3.87RR61 pKa = 11.84CPNYY65 pKa = 10.37LRR67 pKa = 11.84TDD69 pKa = 3.46EE70 pKa = 5.1PGAGLDD76 pKa = 3.72FNFCEE81 pKa = 4.18EE82 pKa = 4.34HH83 pKa = 6.44TDD85 pKa = 3.71HH86 pKa = 7.05EE87 pKa = 4.84VARR90 pKa = 4.58
MM1 pKa = 7.63PNDD4 pKa = 3.34HH5 pKa = 7.13EE6 pKa = 4.61YY7 pKa = 11.46AFDD10 pKa = 3.66SYY12 pKa = 11.55GDD14 pKa = 4.1EE15 pKa = 4.11EE16 pKa = 5.58SEE18 pKa = 4.19PQDD21 pKa = 4.86ASDD24 pKa = 5.03FDD26 pKa = 6.11DD27 pKa = 4.67GDD29 pKa = 4.52AYY31 pKa = 11.1DD32 pKa = 5.49DD33 pKa = 4.23ADD35 pKa = 4.09ADD37 pKa = 4.0EE38 pKa = 4.88EE39 pKa = 4.46DD40 pKa = 4.27RR41 pKa = 11.84TDD43 pKa = 3.83LGPDD47 pKa = 3.34GVVRR51 pKa = 11.84CDD53 pKa = 3.53FRR55 pKa = 11.84DD56 pKa = 3.7ANGEE60 pKa = 3.87RR61 pKa = 11.84CPNYY65 pKa = 10.37LRR67 pKa = 11.84TDD69 pKa = 3.46EE70 pKa = 5.1PGAGLDD76 pKa = 3.72FNFCEE81 pKa = 4.18EE82 pKa = 4.34HH83 pKa = 6.44TDD85 pKa = 3.71HH86 pKa = 7.05EE87 pKa = 4.84VARR90 pKa = 4.58
Molecular weight: 10.16 kDa
Isoelectric point according different methods:
Protein with the highest isoelectric point:
>tr|A0A285QAS2|A0A285QAS2_9SPHN Uncharacterized protein OS=Sphingomonas guangdongensis OX=1141890 GN=SAMN06297144_0314 PE=4 SV=1
MM1 pKa = 7.41AARR4 pKa = 11.84RR5 pKa = 11.84ASPSAVKK12 pKa = 10.6LNRR15 pKa = 11.84TYY17 pKa = 11.39DD18 pKa = 3.67VAEE21 pKa = 3.9LAARR25 pKa = 11.84LGVHH29 pKa = 6.53KK30 pKa = 10.11NTVRR34 pKa = 11.84HH35 pKa = 4.67WQRR38 pKa = 11.84DD39 pKa = 3.39GLKK42 pKa = 9.69PLDD45 pKa = 3.46GRR47 pKa = 11.84RR48 pKa = 11.84PVLFHH53 pKa = 6.78GSTVRR58 pKa = 11.84AFLSSRR64 pKa = 11.84SASRR68 pKa = 11.84KK69 pKa = 9.26SPCPPGTLYY78 pKa = 10.8CFRR81 pKa = 11.84CRR83 pKa = 11.84APRR86 pKa = 11.84APALGMVDD94 pKa = 4.09YY95 pKa = 10.95LPISATGGNVRR106 pKa = 11.84AICATCEE113 pKa = 4.02TVMHH117 pKa = 6.54RR118 pKa = 11.84RR119 pKa = 11.84AAQATLASILPGCDD133 pKa = 3.07VQVVQAPPRR142 pKa = 11.84LKK144 pKa = 10.68GSPSPSLDD152 pKa = 3.25CDD154 pKa = 4.09LEE156 pKa = 4.36RR157 pKa = 11.84QATTT161 pKa = 3.34
MM1 pKa = 7.41AARR4 pKa = 11.84RR5 pKa = 11.84ASPSAVKK12 pKa = 10.6LNRR15 pKa = 11.84TYY17 pKa = 11.39DD18 pKa = 3.67VAEE21 pKa = 3.9LAARR25 pKa = 11.84LGVHH29 pKa = 6.53KK30 pKa = 10.11NTVRR34 pKa = 11.84HH35 pKa = 4.67WQRR38 pKa = 11.84DD39 pKa = 3.39GLKK42 pKa = 9.69PLDD45 pKa = 3.46GRR47 pKa = 11.84RR48 pKa = 11.84PVLFHH53 pKa = 6.78GSTVRR58 pKa = 11.84AFLSSRR64 pKa = 11.84SASRR68 pKa = 11.84KK69 pKa = 9.26SPCPPGTLYY78 pKa = 10.8CFRR81 pKa = 11.84CRR83 pKa = 11.84APRR86 pKa = 11.84APALGMVDD94 pKa = 4.09YY95 pKa = 10.95LPISATGGNVRR106 pKa = 11.84AICATCEE113 pKa = 4.02TVMHH117 pKa = 6.54RR118 pKa = 11.84RR119 pKa = 11.84AAQATLASILPGCDD133 pKa = 3.07VQVVQAPPRR142 pKa = 11.84LKK144 pKa = 10.68GSPSPSLDD152 pKa = 3.25CDD154 pKa = 4.09LEE156 pKa = 4.36RR157 pKa = 11.84QATTT161 pKa = 3.34
Molecular weight: 17.38 kDa
Isoelectric point according different methods:
Peptides (in silico digests for buttom-up proteomics)
Below you can find in silico digests of the whole proteome with Trypsin, Chymotrypsin, Trypsin+LysC, LysN, ArgC proteases suitable for different mass spec machines.| Try ESI |
 |
|---|
| ChTry ESI |
 |
|---|
| ArgC ESI |
 |
|---|
| LysN ESI |
 |
|---|
| TryLysC ESI |
 |
|---|
| Try MALDI |
 |
|---|
| ChTry MALDI |
 |
|---|
| ArgC MALDI |
 |
|---|
| LysN MALDI |
 |
|---|
| TryLysC MALDI |
 |
|---|
| Try LTQ |
 |
|---|
| ChTry LTQ |
 |
|---|
| ArgC LTQ |
 |
|---|
| LysN LTQ |
 |
|---|
| TryLysC LTQ |
 |
|---|
| Try MSlow |
 |
|---|
| ChTry MSlow |
 |
|---|
| ArgC MSlow |
 |
|---|
| LysN MSlow |
 |
|---|
| TryLysC MSlow |
 |
|---|
| Try MShigh |
 |
|---|
| ChTry MShigh |
 |
|---|
| ArgC MShigh |
 |
|---|
| LysN MShigh |
 |
|---|
| TryLysC MShigh |
 |
|---|
General Statistics
Number of major isoforms |
Number of additional isoforms |
Number of all proteins |
Number of amino acids |
Min. Seq. Length |
Max. Seq. Length |
Avg. Seq. Length |
Avg. Mol. Weight |
|---|---|---|---|---|---|---|---|
0 |
1075973 |
27 |
2486 |
311.5 |
33.41 |
Amino acid frequency
Ala |
Cys |
Asp |
Glu |
Phe |
Gly |
His |
Ile |
Lys |
Leu |
|---|---|---|---|---|---|---|---|---|---|
14.533 ± 0.072 | 0.699 ± 0.011 |
5.934 ± 0.032 | 5.065 ± 0.038 |
3.334 ± 0.025 | 9.032 ± 0.046 |
1.846 ± 0.023 | 4.421 ± 0.03 |
2.343 ± 0.029 | 10.141 ± 0.053 |
Met |
Asn |
Gln |
Pro |
Arg |
Ser |
Thr |
Val |
Trp |
Tyr |
|---|---|---|---|---|---|---|---|---|---|
2.062 ± 0.021 | 2.323 ± 0.036 |
5.485 ± 0.036 | 2.949 ± 0.021 |
7.985 ± 0.048 | 4.957 ± 0.031 |
5.606 ± 0.039 | 7.731 ± 0.031 |
1.445 ± 0.02 | 2.108 ± 0.023 |
Most of the basic statistics you can see at this page can be downloaded from this CSV file
Proteome-pI is available under Creative Commons Attribution-NoDerivs license, for more details see here
| Reference: Kozlowski LP. Proteome-pI 2.0: Proteome Isoelectric Point Database Update. Nucleic Acids Res. 2021, doi: 10.1093/nar/gkab944 | Contact: Lukasz P. Kozlowski |
