Herbiconiux sp. SALV-R1
Taxonomy: cellular organisms; Bacteria; Terrabacteria group; Actinobacteria; Actinomycetia; Micrococcales; Microbacteriaceae; Herbiconiux; unclassified Herbiconiux
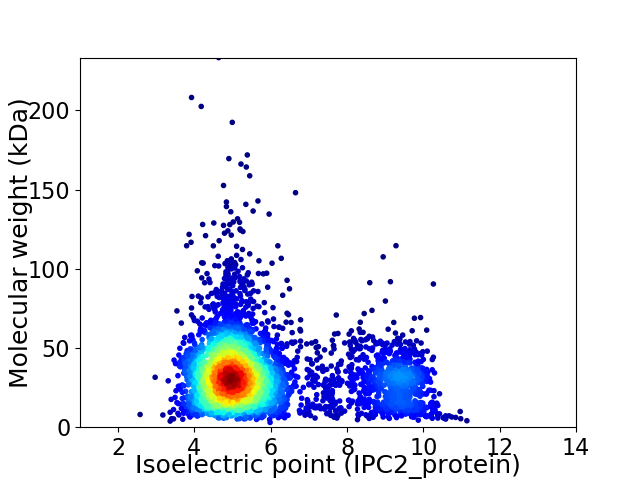
Average proteome isoelectric point is 5.9
Get precalculated fractions of proteins

Virtual 2D-PAGE plot for 4153 proteins (isoelectric point calculated using IPC2_protein)
Get csv file with sequences according to given criteria:
* You can choose from 21 different methods for calculating isoelectric point
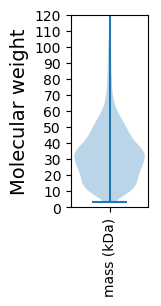
Summary statistics related to proteome-wise predictions


Protein with the lowest isoelectric point:
>tr|A0A6M5J2W1|A0A6M5J2W1_9MICO DUF3021 domain-containing protein OS=Herbiconiux sp. SALV-R1 OX=2735133 GN=HL652_13830 PE=4 SV=1
MM1 pKa = 7.46HH2 pKa = 7.56RR3 pKa = 11.84RR4 pKa = 11.84TTAALRR10 pKa = 11.84TTTLLAAVSLLAAGCSAGGDD30 pKa = 3.37AGSTGSASGGDD41 pKa = 3.98DD42 pKa = 4.3VEE44 pKa = 4.47LTYY47 pKa = 11.01QSAEE51 pKa = 4.29GEE53 pKa = 4.61CASGPRR59 pKa = 11.84DD60 pKa = 3.31GVDD63 pKa = 3.1YY64 pKa = 8.83DD65 pKa = 3.99TADD68 pKa = 3.42ALIKK72 pKa = 10.55SFQEE76 pKa = 3.79PSEE79 pKa = 4.3GLLQTEE85 pKa = 5.18KK86 pKa = 10.9LPQPLGADD94 pKa = 3.31TTIAFLNNDD103 pKa = 3.71TAVAGIMYY111 pKa = 10.26AAIQKK116 pKa = 9.73AAADD120 pKa = 3.65AGINLVNVSTGTDD133 pKa = 3.16AQSINSALNSVVEE146 pKa = 4.48LDD148 pKa = 3.56PDD150 pKa = 3.85AVISVAIDD158 pKa = 2.96ATFYY162 pKa = 10.94QDD164 pKa = 3.92QLKK167 pKa = 9.91QLEE170 pKa = 4.48ANGVPIVYY178 pKa = 10.22SSQPNADD185 pKa = 3.6EE186 pKa = 5.03FGLDD190 pKa = 4.3DD191 pKa = 5.34SLGGYY196 pKa = 9.49NGSLVNGKK204 pKa = 8.94VLAAGAVAFTCGTGDD219 pKa = 4.28DD220 pKa = 3.88FVFYY224 pKa = 10.47NIPEE228 pKa = 4.48LGFSAIQLEE237 pKa = 4.66STQEE241 pKa = 3.89YY242 pKa = 10.08LAEE245 pKa = 4.38LCPDD249 pKa = 3.49CNLRR253 pKa = 11.84VVDD256 pKa = 5.33ISIADD261 pKa = 3.86PSPADD266 pKa = 4.25KK267 pKa = 10.51IVSDD271 pKa = 4.09LQSHH275 pKa = 7.18PEE277 pKa = 3.39TDD279 pKa = 4.02YY280 pKa = 11.28FVTPADD286 pKa = 3.55QFQVGLADD294 pKa = 3.69KK295 pKa = 10.54AQLAGLTNAYY305 pKa = 10.38GFGQSSLPPNVQQLADD321 pKa = 3.93GLQSAGFAVDD331 pKa = 3.93LDD333 pKa = 3.57MYY335 pKa = 10.6MYY337 pKa = 9.47LTLDD341 pKa = 3.23EE342 pKa = 5.09AFRR345 pKa = 11.84KK346 pKa = 8.9IQGVYY351 pKa = 9.32QPYY354 pKa = 10.58DD355 pKa = 3.01DD356 pKa = 4.07WEE358 pKa = 4.19AVNRR362 pKa = 11.84SVSRR366 pKa = 11.84VLTPANAGEE375 pKa = 4.09YY376 pKa = 10.39LGGFVAYY383 pKa = 9.48PGMQDD388 pKa = 4.36DD389 pKa = 6.58FKK391 pKa = 10.81TLWGKK396 pKa = 10.05
MM1 pKa = 7.46HH2 pKa = 7.56RR3 pKa = 11.84RR4 pKa = 11.84TTAALRR10 pKa = 11.84TTTLLAAVSLLAAGCSAGGDD30 pKa = 3.37AGSTGSASGGDD41 pKa = 3.98DD42 pKa = 4.3VEE44 pKa = 4.47LTYY47 pKa = 11.01QSAEE51 pKa = 4.29GEE53 pKa = 4.61CASGPRR59 pKa = 11.84DD60 pKa = 3.31GVDD63 pKa = 3.1YY64 pKa = 8.83DD65 pKa = 3.99TADD68 pKa = 3.42ALIKK72 pKa = 10.55SFQEE76 pKa = 3.79PSEE79 pKa = 4.3GLLQTEE85 pKa = 5.18KK86 pKa = 10.9LPQPLGADD94 pKa = 3.31TTIAFLNNDD103 pKa = 3.71TAVAGIMYY111 pKa = 10.26AAIQKK116 pKa = 9.73AAADD120 pKa = 3.65AGINLVNVSTGTDD133 pKa = 3.16AQSINSALNSVVEE146 pKa = 4.48LDD148 pKa = 3.56PDD150 pKa = 3.85AVISVAIDD158 pKa = 2.96ATFYY162 pKa = 10.94QDD164 pKa = 3.92QLKK167 pKa = 9.91QLEE170 pKa = 4.48ANGVPIVYY178 pKa = 10.22SSQPNADD185 pKa = 3.6EE186 pKa = 5.03FGLDD190 pKa = 4.3DD191 pKa = 5.34SLGGYY196 pKa = 9.49NGSLVNGKK204 pKa = 8.94VLAAGAVAFTCGTGDD219 pKa = 4.28DD220 pKa = 3.88FVFYY224 pKa = 10.47NIPEE228 pKa = 4.48LGFSAIQLEE237 pKa = 4.66STQEE241 pKa = 3.89YY242 pKa = 10.08LAEE245 pKa = 4.38LCPDD249 pKa = 3.49CNLRR253 pKa = 11.84VVDD256 pKa = 5.33ISIADD261 pKa = 3.86PSPADD266 pKa = 4.25KK267 pKa = 10.51IVSDD271 pKa = 4.09LQSHH275 pKa = 7.18PEE277 pKa = 3.39TDD279 pKa = 4.02YY280 pKa = 11.28FVTPADD286 pKa = 3.55QFQVGLADD294 pKa = 3.69KK295 pKa = 10.54AQLAGLTNAYY305 pKa = 10.38GFGQSSLPPNVQQLADD321 pKa = 3.93GLQSAGFAVDD331 pKa = 3.93LDD333 pKa = 3.57MYY335 pKa = 10.6MYY337 pKa = 9.47LTLDD341 pKa = 3.23EE342 pKa = 5.09AFRR345 pKa = 11.84KK346 pKa = 8.9IQGVYY351 pKa = 9.32QPYY354 pKa = 10.58DD355 pKa = 3.01DD356 pKa = 4.07WEE358 pKa = 4.19AVNRR362 pKa = 11.84SVSRR366 pKa = 11.84VLTPANAGEE375 pKa = 4.09YY376 pKa = 10.39LGGFVAYY383 pKa = 9.48PGMQDD388 pKa = 4.36DD389 pKa = 6.58FKK391 pKa = 10.81TLWGKK396 pKa = 10.05
Molecular weight: 41.62 kDa
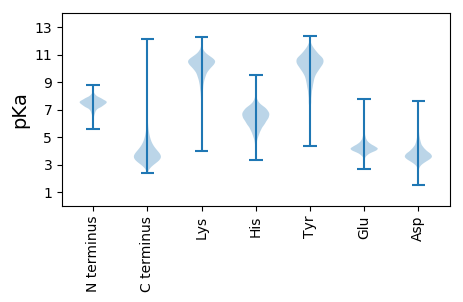
Isoelectric point according different methods:
Protein with the highest isoelectric point:
>tr|A0A6M5IQK4|A0A6M5IQK4_9MICO Substrate-binding domain-containing protein OS=Herbiconiux sp. SALV-R1 OX=2735133 GN=HL652_03595 PE=4 SV=1
MM1 pKa = 7.4GSVIKK6 pKa = 10.42KK7 pKa = 8.47RR8 pKa = 11.84RR9 pKa = 11.84KK10 pKa = 9.22RR11 pKa = 11.84MAKK14 pKa = 9.41KK15 pKa = 9.87KK16 pKa = 9.7HH17 pKa = 5.84RR18 pKa = 11.84KK19 pKa = 8.56LLRR22 pKa = 11.84KK23 pKa = 7.78TRR25 pKa = 11.84HH26 pKa = 3.65QRR28 pKa = 11.84RR29 pKa = 11.84NKK31 pKa = 9.78KK32 pKa = 9.85
MM1 pKa = 7.4GSVIKK6 pKa = 10.42KK7 pKa = 8.47RR8 pKa = 11.84RR9 pKa = 11.84KK10 pKa = 9.22RR11 pKa = 11.84MAKK14 pKa = 9.41KK15 pKa = 9.87KK16 pKa = 9.7HH17 pKa = 5.84RR18 pKa = 11.84KK19 pKa = 8.56LLRR22 pKa = 11.84KK23 pKa = 7.78TRR25 pKa = 11.84HH26 pKa = 3.65QRR28 pKa = 11.84RR29 pKa = 11.84NKK31 pKa = 9.78KK32 pKa = 9.85
Molecular weight: 4.08 kDa
Isoelectric point according different methods:
Peptides (in silico digests for buttom-up proteomics)
Below you can find in silico digests of the whole proteome with Trypsin, Chymotrypsin, Trypsin+LysC, LysN, ArgC proteases suitable for different mass spec machines.| Try ESI |
 |
|---|
| ChTry ESI |
 |
|---|
| ArgC ESI |
 |
|---|
| LysN ESI |
 |
|---|
| TryLysC ESI |
 |
|---|
| Try MALDI |
 |
|---|
| ChTry MALDI |
 |
|---|
| ArgC MALDI |
 |
|---|
| LysN MALDI |
 |
|---|
| TryLysC MALDI |
 |
|---|
| Try LTQ |
 |
|---|
| ChTry LTQ |
 |
|---|
| ArgC LTQ |
 |
|---|
| LysN LTQ |
 |
|---|
| TryLysC LTQ |
 |
|---|
| Try MSlow |
 |
|---|
| ChTry MSlow |
 |
|---|
| ArgC MSlow |
 |
|---|
| LysN MSlow |
 |
|---|
| TryLysC MSlow |
 |
|---|
| Try MShigh |
 |
|---|
| ChTry MShigh |
 |
|---|
| ArgC MShigh |
 |
|---|
| LysN MShigh |
 |
|---|
| TryLysC MShigh |
 |
|---|
General Statistics
Number of major isoforms |
Number of additional isoforms |
Number of all proteins |
Number of amino acids |
Min. Seq. Length |
Max. Seq. Length |
Avg. Seq. Length |
Avg. Mol. Weight |
|---|---|---|---|---|---|---|---|
0 |
1355947 |
29 |
2219 |
326.5 |
34.73 |
Amino acid frequency
Ala |
Cys |
Asp |
Glu |
Phe |
Gly |
His |
Ile |
Lys |
Leu |
|---|---|---|---|---|---|---|---|---|---|
13.624 ± 0.053 | 0.489 ± 0.008 |
6.061 ± 0.031 | 5.745 ± 0.036 |
3.202 ± 0.024 | 9.216 ± 0.032 |
1.911 ± 0.02 | 4.192 ± 0.026 |
1.885 ± 0.025 | 10.143 ± 0.045 |
Met |
Asn |
Gln |
Pro |
Arg |
Ser |
Thr |
Val |
Trp |
Tyr |
|---|---|---|---|---|---|---|---|---|---|
1.609 ± 0.013 | 1.949 ± 0.022 |
5.537 ± 0.029 | 2.613 ± 0.021 |
6.964 ± 0.045 | 6.081 ± 0.031 |
6.165 ± 0.035 | 9.172 ± 0.039 |
1.446 ± 0.015 | 1.994 ± 0.019 |
Most of the basic statistics you can see at this page can be downloaded from this CSV file
Proteome-pI is available under Creative Commons Attribution-NoDerivs license, for more details see here
| Reference: Kozlowski LP. Proteome-pI 2.0: Proteome Isoelectric Point Database Update. Nucleic Acids Res. 2021, doi: 10.1093/nar/gkab944 | Contact: Lukasz P. Kozlowski |
