Lizard adenovirus 2
Taxonomy: Viruses; Varidnaviria; Bamfordvirae; Preplasmiviricota; Tectiliviricetes; Rowavirales; Adenoviridae; Atadenovirus; Lizard atadenovirus A
Average proteome isoelectric point is 6.71
Get precalculated fractions of proteins

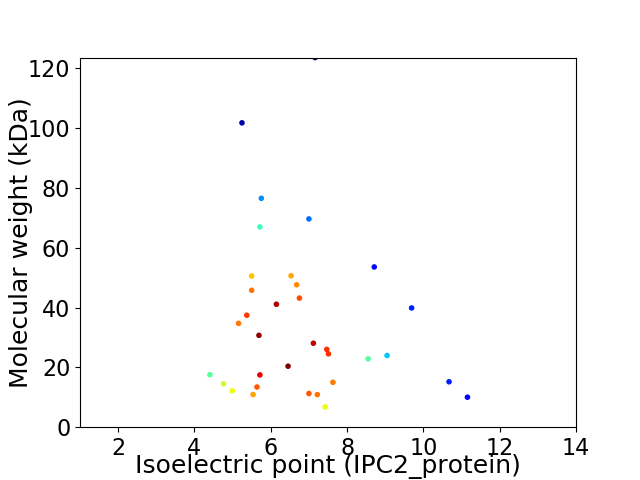
Virtual 2D-PAGE plot for 34 proteins (isoelectric point calculated using IPC2_protein)
Get csv file with sequences according to given criteria:
* You can choose from 21 different methods for calculating isoelectric point
Summary statistics related to proteome-wise predictions


Protein with the lowest isoelectric point:
>tr|A0A076FTC5|A0A076FTC5_9ADEN Protein ORF2 OS=Lizard adenovirus 2 OX=874272 PE=4 SV=1
MM1 pKa = 7.81DD2 pKa = 4.38TFGLDD7 pKa = 3.23IVNMSTDD14 pKa = 3.89EE15 pKa = 3.7IAAILKK21 pKa = 10.32KK22 pKa = 9.63IDD24 pKa = 3.24RR25 pKa = 11.84FGYY28 pKa = 9.38EE29 pKa = 4.78LISINYY35 pKa = 8.97DD36 pKa = 3.18AFPFGPFRR44 pKa = 11.84MSFSLGSDD52 pKa = 2.61TVMYY56 pKa = 10.36YY57 pKa = 10.69VSQKK61 pKa = 11.1DD62 pKa = 3.9LALEE66 pKa = 4.12WDD68 pKa = 4.85PIQYY72 pKa = 10.7LNWIRR77 pKa = 11.84EE78 pKa = 4.12ASDD81 pKa = 5.32LNVNWVSCEE90 pKa = 3.52RR91 pKa = 11.84VPWWKK96 pKa = 10.08IFPMLEE102 pKa = 3.89EE103 pKa = 4.81RR104 pKa = 11.84KK105 pKa = 10.33DD106 pKa = 3.91SLWTCEE112 pKa = 3.72NSVFFIPPSRR122 pKa = 11.84SHH124 pKa = 7.03PSWEE128 pKa = 3.81YY129 pKa = 11.07FNYY132 pKa = 9.81FWSQCHH138 pKa = 6.09SDD140 pKa = 3.61APLDD144 pKa = 3.96IGWSS148 pKa = 3.51
MM1 pKa = 7.81DD2 pKa = 4.38TFGLDD7 pKa = 3.23IVNMSTDD14 pKa = 3.89EE15 pKa = 3.7IAAILKK21 pKa = 10.32KK22 pKa = 9.63IDD24 pKa = 3.24RR25 pKa = 11.84FGYY28 pKa = 9.38EE29 pKa = 4.78LISINYY35 pKa = 8.97DD36 pKa = 3.18AFPFGPFRR44 pKa = 11.84MSFSLGSDD52 pKa = 2.61TVMYY56 pKa = 10.36YY57 pKa = 10.69VSQKK61 pKa = 11.1DD62 pKa = 3.9LALEE66 pKa = 4.12WDD68 pKa = 4.85PIQYY72 pKa = 10.7LNWIRR77 pKa = 11.84EE78 pKa = 4.12ASDD81 pKa = 5.32LNVNWVSCEE90 pKa = 3.52RR91 pKa = 11.84VPWWKK96 pKa = 10.08IFPMLEE102 pKa = 3.89EE103 pKa = 4.81RR104 pKa = 11.84KK105 pKa = 10.33DD106 pKa = 3.91SLWTCEE112 pKa = 3.72NSVFFIPPSRR122 pKa = 11.84SHH124 pKa = 7.03PSWEE128 pKa = 3.81YY129 pKa = 11.07FNYY132 pKa = 9.81FWSQCHH138 pKa = 6.09SDD140 pKa = 3.61APLDD144 pKa = 3.96IGWSS148 pKa = 3.51
Molecular weight: 17.57 kDa
Isoelectric point according different methods:
Protein with the highest isoelectric point:
>tr|A0A076FUM5|A0A076FUM5_9ADEN 100K OS=Lizard adenovirus 2 OX=874272 PE=4 SV=1
MM1 pKa = 7.51ARR3 pKa = 11.84LRR5 pKa = 11.84LVTCRR10 pKa = 11.84TARR13 pKa = 11.84THH15 pKa = 4.23TRR17 pKa = 11.84RR18 pKa = 11.84RR19 pKa = 11.84PRR21 pKa = 11.84RR22 pKa = 11.84RR23 pKa = 11.84VTRR26 pKa = 11.84SRR28 pKa = 11.84TVTRR32 pKa = 11.84TTRR35 pKa = 11.84VTRR38 pKa = 11.84RR39 pKa = 11.84GHH41 pKa = 4.85NVVYY45 pKa = 8.98KK46 pKa = 8.94TMRR49 pKa = 11.84KK50 pKa = 5.48TARR53 pKa = 11.84IGSRR57 pKa = 11.84RR58 pKa = 11.84MRR60 pKa = 11.84GGFLPLLAPILAAAIGAIPGIVVAARR86 pKa = 11.84QKK88 pKa = 10.91
MM1 pKa = 7.51ARR3 pKa = 11.84LRR5 pKa = 11.84LVTCRR10 pKa = 11.84TARR13 pKa = 11.84THH15 pKa = 4.23TRR17 pKa = 11.84RR18 pKa = 11.84RR19 pKa = 11.84PRR21 pKa = 11.84RR22 pKa = 11.84RR23 pKa = 11.84VTRR26 pKa = 11.84SRR28 pKa = 11.84TVTRR32 pKa = 11.84TTRR35 pKa = 11.84VTRR38 pKa = 11.84RR39 pKa = 11.84GHH41 pKa = 4.85NVVYY45 pKa = 8.98KK46 pKa = 8.94TMRR49 pKa = 11.84KK50 pKa = 5.48TARR53 pKa = 11.84IGSRR57 pKa = 11.84RR58 pKa = 11.84MRR60 pKa = 11.84GGFLPLLAPILAAAIGAIPGIVVAARR86 pKa = 11.84QKK88 pKa = 10.91
Molecular weight: 10.03 kDa
Isoelectric point according different methods:
Peptides (in silico digests for buttom-up proteomics)
Below you can find in silico digests of the whole proteome with Trypsin, Chymotrypsin, Trypsin+LysC, LysN, ArgC proteases suitable for different mass spec machines.| Try ESI |
 |
|---|
| ChTry ESI |
 |
|---|
| ArgC ESI |
 |
|---|
| LysN ESI |
 |
|---|
| TryLysC ESI |
 |
|---|
| Try MALDI |
 |
|---|
| ChTry MALDI |
 |
|---|
| ArgC MALDI |
 |
|---|
| LysN MALDI |
 |
|---|
| TryLysC MALDI |
 |
|---|
| Try LTQ |
 |
|---|
| ChTry LTQ |
 |
|---|
| ArgC LTQ |
 |
|---|
| LysN LTQ |
 |
|---|
| TryLysC LTQ |
 |
|---|
| Try MSlow |
 |
|---|
| ChTry MSlow |
 |
|---|
| ArgC MSlow |
 |
|---|
| LysN MSlow |
 |
|---|
| TryLysC MSlow |
 |
|---|
| Try MShigh |
 |
|---|
| ChTry MShigh |
 |
|---|
| ArgC MShigh |
 |
|---|
| LysN MShigh |
 |
|---|
| TryLysC MShigh |
 |
|---|
General Statistics
Number of major isoforms |
Number of additional isoforms |
Number of all proteins |
Number of amino acids |
Min. Seq. Length |
Max. Seq. Length |
Avg. Seq. Length |
Avg. Mol. Weight |
|---|---|---|---|---|---|---|---|
0 |
10779 |
57 |
1075 |
317.0 |
35.73 |
Amino acid frequency
Ala |
Cys |
Asp |
Glu |
Phe |
Gly |
His |
Ile |
Lys |
Leu |
|---|---|---|---|---|---|---|---|---|---|
6.374 ± 0.303 | 2.301 ± 0.367 |
4.499 ± 0.234 | 5.956 ± 0.478 |
4.806 ± 0.27 | 6.244 ± 0.46 |
2.013 ± 0.203 | 4.49 ± 0.206 |
5.121 ± 0.547 | 9.676 ± 0.42 |
Met |
Asn |
Gln |
Pro |
Arg |
Ser |
Thr |
Val |
Trp |
Tyr |
|---|---|---|---|---|---|---|---|---|---|
2.18 ± 0.111 | 5.167 ± 0.424 |
6.123 ± 0.369 | 4.166 ± 0.287 |
5.873 ± 0.559 | 7.672 ± 0.366 |
6.049 ± 0.389 | 6.086 ± 0.327 |
1.577 ± 0.146 | 3.627 ± 0.312 |
Most of the basic statistics you can see at this page can be downloaded from this CSV file
Proteome-pI is available under Creative Commons Attribution-NoDerivs license, for more details see here
| Reference: Kozlowski LP. Proteome-pI 2.0: Proteome Isoelectric Point Database Update. Nucleic Acids Res. 2021, doi: 10.1093/nar/gkab944 | Contact: Lukasz P. Kozlowski |
