Giardia muris
Taxonomy: cellular organisms; Eukaryota; Metamonada; Fornicata; Diplomonadida; Hexamitidae; Giardiinae; Giardia
Average proteome isoelectric point is 6.24
Get precalculated fractions of proteins

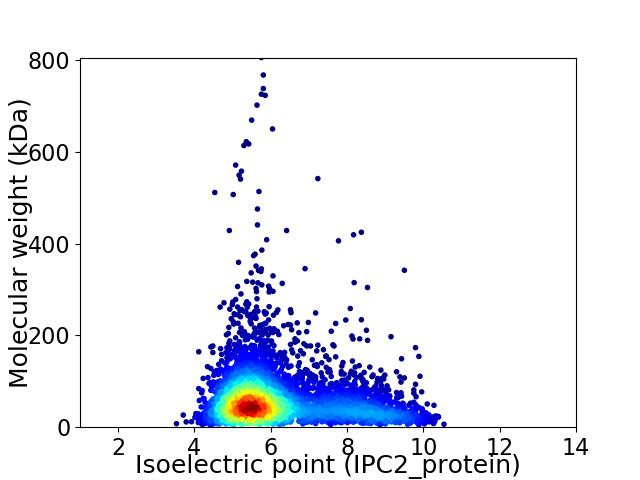
Virtual 2D-PAGE plot for 4560 proteins (isoelectric point calculated using IPC2_protein)
Get csv file with sequences according to given criteria:
* You can choose from 21 different methods for calculating isoelectric point
Summary statistics related to proteome-wise predictions


Protein with the lowest isoelectric point:
>tr|A0A4Z1SNN7|A0A4Z1SNN7_GIAMU PVSP OS=Giardia muris OX=5742 GN=GMRT_24405 PE=4 SV=1
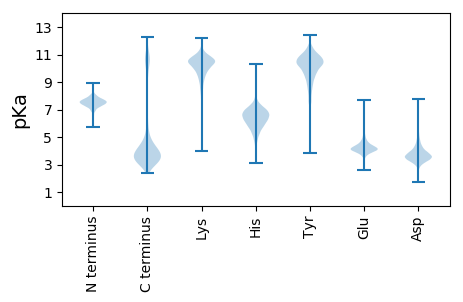
MM1 pKa = 8.02PLTFLRR7 pKa = 11.84TWGEE11 pKa = 4.03VCDD14 pKa = 4.52HH15 pKa = 6.56YY16 pKa = 11.87NNEE19 pKa = 4.04AEE21 pKa = 4.36KK22 pKa = 9.89TFAAIMTIIDD32 pKa = 3.93EE33 pKa = 4.86FCTTMEE39 pKa = 4.81GNDD42 pKa = 3.57SDD44 pKa = 5.03ASLDD48 pKa = 3.66FSDD51 pKa = 3.77FTKK54 pKa = 11.0YY55 pKa = 10.69GAVQSGCQYY64 pKa = 11.3LVIANFGLNVVQFLPFEE81 pKa = 4.46GTVDD85 pKa = 3.67PQSWADD91 pKa = 4.12FIKK94 pKa = 10.08LTEE97 pKa = 4.11SDD99 pKa = 3.59EE100 pKa = 4.14FRR102 pKa = 11.84SLFVV106 pKa = 3.42
MM1 pKa = 8.02PLTFLRR7 pKa = 11.84TWGEE11 pKa = 4.03VCDD14 pKa = 4.52HH15 pKa = 6.56YY16 pKa = 11.87NNEE19 pKa = 4.04AEE21 pKa = 4.36KK22 pKa = 9.89TFAAIMTIIDD32 pKa = 3.93EE33 pKa = 4.86FCTTMEE39 pKa = 4.81GNDD42 pKa = 3.57SDD44 pKa = 5.03ASLDD48 pKa = 3.66FSDD51 pKa = 3.77FTKK54 pKa = 11.0YY55 pKa = 10.69GAVQSGCQYY64 pKa = 11.3LVIANFGLNVVQFLPFEE81 pKa = 4.46GTVDD85 pKa = 3.67PQSWADD91 pKa = 4.12FIKK94 pKa = 10.08LTEE97 pKa = 4.11SDD99 pKa = 3.59EE100 pKa = 4.14FRR102 pKa = 11.84SLFVV106 pKa = 3.42
Molecular weight: 12.0 kDa
Isoelectric point according different methods:
Protein with the highest isoelectric point:
>tr|A0A4Z1SLP3|A0A4Z1SLP3_GIAMU Ankyrin repeat protein 2 OS=Giardia muris OX=5742 GN=GMRT_16401 PE=4 SV=1
MM1 pKa = 7.34NPTVKK6 pKa = 10.13VFSATGAPAGEE17 pKa = 4.41LPRR20 pKa = 11.84PAVFSVPIRR29 pKa = 11.84PDD31 pKa = 3.04IISFVHH37 pKa = 5.54TQLAKK42 pKa = 10.87NNRR45 pKa = 11.84TPYY48 pKa = 10.25AVSRR52 pKa = 11.84YY53 pKa = 10.48AGVQCTAHH61 pKa = 5.25SWGPGRR67 pKa = 11.84AVARR71 pKa = 11.84LPRR74 pKa = 11.84KK75 pKa = 9.66HH76 pKa = 6.43GGIGAYY82 pKa = 10.49ANFARR87 pKa = 11.84GGHH90 pKa = 5.33MAHH93 pKa = 6.52PTSVNRR99 pKa = 11.84RR100 pKa = 11.84WCRR103 pKa = 11.84CVNLNLRR110 pKa = 11.84RR111 pKa = 11.84YY112 pKa = 9.15AVASALAASANAQLVEE128 pKa = 4.18ARR130 pKa = 11.84GHH132 pKa = 6.57RR133 pKa = 11.84IGNVKK138 pKa = 10.45SIPCVVDD145 pKa = 3.4VSDD148 pKa = 4.02VKK150 pKa = 10.21KK151 pKa = 9.26TKK153 pKa = 10.53DD154 pKa = 2.97AMGIIRR160 pKa = 11.84AIGAAEE166 pKa = 3.7DD167 pKa = 3.67VEE169 pKa = 4.39RR170 pKa = 11.84CKK172 pKa = 10.62EE173 pKa = 3.97SRR175 pKa = 11.84GIRR178 pKa = 11.84AGRR181 pKa = 11.84GKK183 pKa = 9.34MRR185 pKa = 11.84NRR187 pKa = 11.84RR188 pKa = 11.84YY189 pKa = 10.41RR190 pKa = 11.84MRR192 pKa = 11.84RR193 pKa = 11.84GPLLIHH199 pKa = 6.64AGEE202 pKa = 4.42NIEE205 pKa = 3.96PAFRR209 pKa = 11.84NIPGLDD215 pKa = 3.15ICHH218 pKa = 5.93VSDD221 pKa = 3.89MKK223 pKa = 11.19LLEE226 pKa = 4.54LAPGSHH232 pKa = 7.82PGRR235 pKa = 11.84LIIWTKK241 pKa = 10.69GAFASLDD248 pKa = 3.41QVYY251 pKa = 10.23AAMKK255 pKa = 10.4GYY257 pKa = 7.32TLPMPVISQTDD268 pKa = 3.36IEE270 pKa = 5.57RR271 pKa = 11.84IMQSDD276 pKa = 3.4IVTSTFKK283 pKa = 10.9AKK285 pKa = 10.0RR286 pKa = 11.84DD287 pKa = 3.48PLRR290 pKa = 11.84IEE292 pKa = 4.64RR293 pKa = 11.84KK294 pKa = 9.72VNPFSDD300 pKa = 3.72PNALKK305 pKa = 10.7RR306 pKa = 11.84LDD308 pKa = 3.57PSKK311 pKa = 11.3
MM1 pKa = 7.34NPTVKK6 pKa = 10.13VFSATGAPAGEE17 pKa = 4.41LPRR20 pKa = 11.84PAVFSVPIRR29 pKa = 11.84PDD31 pKa = 3.04IISFVHH37 pKa = 5.54TQLAKK42 pKa = 10.87NNRR45 pKa = 11.84TPYY48 pKa = 10.25AVSRR52 pKa = 11.84YY53 pKa = 10.48AGVQCTAHH61 pKa = 5.25SWGPGRR67 pKa = 11.84AVARR71 pKa = 11.84LPRR74 pKa = 11.84KK75 pKa = 9.66HH76 pKa = 6.43GGIGAYY82 pKa = 10.49ANFARR87 pKa = 11.84GGHH90 pKa = 5.33MAHH93 pKa = 6.52PTSVNRR99 pKa = 11.84RR100 pKa = 11.84WCRR103 pKa = 11.84CVNLNLRR110 pKa = 11.84RR111 pKa = 11.84YY112 pKa = 9.15AVASALAASANAQLVEE128 pKa = 4.18ARR130 pKa = 11.84GHH132 pKa = 6.57RR133 pKa = 11.84IGNVKK138 pKa = 10.45SIPCVVDD145 pKa = 3.4VSDD148 pKa = 4.02VKK150 pKa = 10.21KK151 pKa = 9.26TKK153 pKa = 10.53DD154 pKa = 2.97AMGIIRR160 pKa = 11.84AIGAAEE166 pKa = 3.7DD167 pKa = 3.67VEE169 pKa = 4.39RR170 pKa = 11.84CKK172 pKa = 10.62EE173 pKa = 3.97SRR175 pKa = 11.84GIRR178 pKa = 11.84AGRR181 pKa = 11.84GKK183 pKa = 9.34MRR185 pKa = 11.84NRR187 pKa = 11.84RR188 pKa = 11.84YY189 pKa = 10.41RR190 pKa = 11.84MRR192 pKa = 11.84RR193 pKa = 11.84GPLLIHH199 pKa = 6.64AGEE202 pKa = 4.42NIEE205 pKa = 3.96PAFRR209 pKa = 11.84NIPGLDD215 pKa = 3.15ICHH218 pKa = 5.93VSDD221 pKa = 3.89MKK223 pKa = 11.19LLEE226 pKa = 4.54LAPGSHH232 pKa = 7.82PGRR235 pKa = 11.84LIIWTKK241 pKa = 10.69GAFASLDD248 pKa = 3.41QVYY251 pKa = 10.23AAMKK255 pKa = 10.4GYY257 pKa = 7.32TLPMPVISQTDD268 pKa = 3.36IEE270 pKa = 5.57RR271 pKa = 11.84IMQSDD276 pKa = 3.4IVTSTFKK283 pKa = 10.9AKK285 pKa = 10.0RR286 pKa = 11.84DD287 pKa = 3.48PLRR290 pKa = 11.84IEE292 pKa = 4.64RR293 pKa = 11.84KK294 pKa = 9.72VNPFSDD300 pKa = 3.72PNALKK305 pKa = 10.7RR306 pKa = 11.84LDD308 pKa = 3.57PSKK311 pKa = 11.3
Molecular weight: 34.16 kDa
Isoelectric point according different methods:
Peptides (in silico digests for buttom-up proteomics)
Below you can find in silico digests of the whole proteome with Trypsin, Chymotrypsin, Trypsin+LysC, LysN, ArgC proteases suitable for different mass spec machines.| Try ESI |
 |
|---|
| ChTry ESI |
 |
|---|
| ArgC ESI |
 |
|---|
| LysN ESI |
 |
|---|
| TryLysC ESI |
 |
|---|
| Try MALDI |
 |
|---|
| ChTry MALDI |
 |
|---|
| ArgC MALDI |
 |
|---|
| LysN MALDI |
 |
|---|
| TryLysC MALDI |
 |
|---|
| Try LTQ |
 |
|---|
| ChTry LTQ |
 |
|---|
| ArgC LTQ |
 |
|---|
| LysN LTQ |
 |
|---|
| TryLysC LTQ |
 |
|---|
| Try MSlow |
 |
|---|
| ChTry MSlow |
 |
|---|
| ArgC MSlow |
 |
|---|
| LysN MSlow |
 |
|---|
| TryLysC MSlow |
 |
|---|
| Try MShigh |
 |
|---|
| ChTry MShigh |
 |
|---|
| ArgC MShigh |
 |
|---|
| LysN MShigh |
 |
|---|
| TryLysC MShigh |
 |
|---|
General Statistics
Number of major isoforms |
Number of additional isoforms |
Number of all proteins |
Number of amino acids |
Min. Seq. Length |
Max. Seq. Length |
Avg. Seq. Length |
Avg. Mol. Weight |
|---|---|---|---|---|---|---|---|
0 |
2636066 |
46 |
7065 |
578.1 |
64.22 |
Amino acid frequency
Ala |
Cys |
Asp |
Glu |
Phe |
Gly |
His |
Ile |
Lys |
Leu |
|---|---|---|---|---|---|---|---|---|---|
8.468 ± 0.043 | 2.064 ± 0.03 |
5.405 ± 0.019 | 6.614 ± 0.038 |
3.368 ± 0.028 | 5.897 ± 0.034 |
2.36 ± 0.013 | 5.133 ± 0.024 |
3.962 ± 0.024 | 11.318 ± 0.042 |
Met |
Asn |
Gln |
Pro |
Arg |
Ser |
Thr |
Val |
Trp |
Tyr |
|---|---|---|---|---|---|---|---|---|---|
2.145 ± 0.015 | 3.221 ± 0.018 |
5.057 ± 0.034 | 4.094 ± 0.025 |
6.74 ± 0.032 | 7.784 ± 0.036 |
6.479 ± 0.021 | 6.119 ± 0.022 |
0.736 ± 0.009 | 3.036 ± 0.02 |
Most of the basic statistics you can see at this page can be downloaded from this CSV file
Proteome-pI is available under Creative Commons Attribution-NoDerivs license, for more details see here
| Reference: Kozlowski LP. Proteome-pI 2.0: Proteome Isoelectric Point Database Update. Nucleic Acids Res. 2021, doi: 10.1093/nar/gkab944 | Contact: Lukasz P. Kozlowski |
