Actinokineospora iranica
Taxonomy: cellular organisms; Bacteria; Terrabacteria group; Actinobacteria; Actinomycetia; Pseudonocardiales; Pseudonocardiaceae; Actinokineospora
Average proteome isoelectric point is 6.37
Get precalculated fractions of proteins

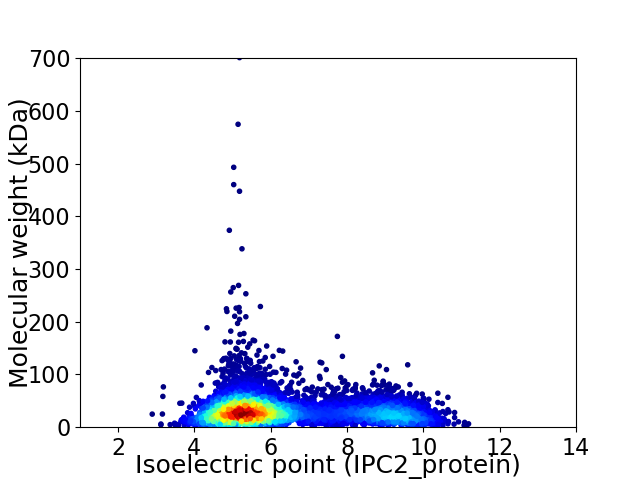
Virtual 2D-PAGE plot for 6124 proteins (isoelectric point calculated using IPC2_protein)
Get csv file with sequences according to given criteria:
* You can choose from 21 different methods for calculating isoelectric point
Summary statistics related to proteome-wise predictions


Protein with the lowest isoelectric point:
>tr|A0A1G6VXP1|A0A1G6VXP1_9PSEU Uncharacterized protein OS=Actinokineospora iranica OX=1271860 GN=SAMN05216174_113126 PE=4 SV=1
MM1 pKa = 8.14RR2 pKa = 11.84SRR4 pKa = 11.84ALYY7 pKa = 10.06SVLFAGTVVVGGLATGGSASAAANCVIGPGVTQTNTTVTGSGANDD52 pKa = 4.12TIDD55 pKa = 4.23CTNSDD60 pKa = 4.15PGKK63 pKa = 9.04TIYY66 pKa = 11.13GNGGNDD72 pKa = 4.15TITGTAFNDD81 pKa = 3.93VIHH84 pKa = 6.97GNDD87 pKa = 3.99GNDD90 pKa = 3.34TLTGGIGNDD99 pKa = 3.63TLSGGLGEE107 pKa = 4.38DD108 pKa = 3.94TVNGSAGNDD117 pKa = 3.46SLTGPGTDD125 pKa = 3.67FAVDD129 pKa = 3.69TLSGGTGTDD138 pKa = 2.66KK139 pKa = 11.02CGAIGIPPDD148 pKa = 3.36IRR150 pKa = 11.84SSCEE154 pKa = 3.59SS155 pKa = 3.2
MM1 pKa = 8.14RR2 pKa = 11.84SRR4 pKa = 11.84ALYY7 pKa = 10.06SVLFAGTVVVGGLATGGSASAAANCVIGPGVTQTNTTVTGSGANDD52 pKa = 4.12TIDD55 pKa = 4.23CTNSDD60 pKa = 4.15PGKK63 pKa = 9.04TIYY66 pKa = 11.13GNGGNDD72 pKa = 4.15TITGTAFNDD81 pKa = 3.93VIHH84 pKa = 6.97GNDD87 pKa = 3.99GNDD90 pKa = 3.34TLTGGIGNDD99 pKa = 3.63TLSGGLGEE107 pKa = 4.38DD108 pKa = 3.94TVNGSAGNDD117 pKa = 3.46SLTGPGTDD125 pKa = 3.67FAVDD129 pKa = 3.69TLSGGTGTDD138 pKa = 2.66KK139 pKa = 11.02CGAIGIPPDD148 pKa = 3.36IRR150 pKa = 11.84SSCEE154 pKa = 3.59SS155 pKa = 3.2
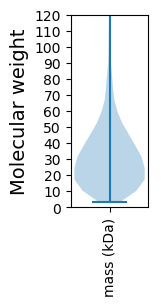
Molecular weight: 14.94 kDa
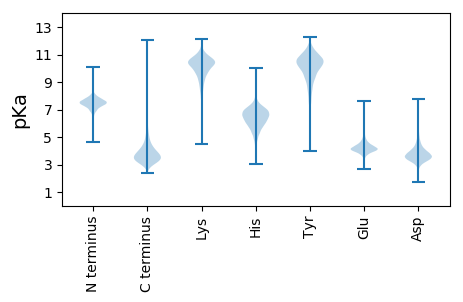
Isoelectric point according different methods:
Protein with the highest isoelectric point:
>tr|A0A1G6QI66|A0A1G6QI66_9PSEU Perosamine synthetase OS=Actinokineospora iranica OX=1271860 GN=SAMN05216174_105314 PE=3 SV=1
MM1 pKa = 7.63AWRR4 pKa = 11.84GRR6 pKa = 11.84LPVGLRR12 pKa = 11.84LSLGLWLSLGLRR24 pKa = 11.84LSLGLLSLRR33 pKa = 11.84LGLPLGRR40 pKa = 11.84GLARR44 pKa = 11.84WVRR47 pKa = 11.84LAGLPLRR54 pKa = 11.84VRR56 pKa = 11.84PAA58 pKa = 3.01
MM1 pKa = 7.63AWRR4 pKa = 11.84GRR6 pKa = 11.84LPVGLRR12 pKa = 11.84LSLGLWLSLGLRR24 pKa = 11.84LSLGLLSLRR33 pKa = 11.84LGLPLGRR40 pKa = 11.84GLARR44 pKa = 11.84WVRR47 pKa = 11.84LAGLPLRR54 pKa = 11.84VRR56 pKa = 11.84PAA58 pKa = 3.01
Molecular weight: 6.36 kDa
Isoelectric point according different methods:
Peptides (in silico digests for buttom-up proteomics)
Below you can find in silico digests of the whole proteome with Trypsin, Chymotrypsin, Trypsin+LysC, LysN, ArgC proteases suitable for different mass spec machines.| Try ESI |
 |
|---|
| ChTry ESI |
 |
|---|
| ArgC ESI |
 |
|---|
| LysN ESI |
 |
|---|
| TryLysC ESI |
 |
|---|
| Try MALDI |
 |
|---|
| ChTry MALDI |
 |
|---|
| ArgC MALDI |
 |
|---|
| LysN MALDI |
 |
|---|
| TryLysC MALDI |
 |
|---|
| Try LTQ |
 |
|---|
| ChTry LTQ |
 |
|---|
| ArgC LTQ |
 |
|---|
| LysN LTQ |
 |
|---|
| TryLysC LTQ |
 |
|---|
| Try MSlow |
 |
|---|
| ChTry MSlow |
 |
|---|
| ArgC MSlow |
 |
|---|
| LysN MSlow |
 |
|---|
| TryLysC MSlow |
 |
|---|
| Try MShigh |
 |
|---|
| ChTry MShigh |
 |
|---|
| ArgC MShigh |
 |
|---|
| LysN MShigh |
 |
|---|
| TryLysC MShigh |
 |
|---|
General Statistics
Number of major isoforms |
Number of additional isoforms |
Number of all proteins |
Number of amino acids |
Min. Seq. Length |
Max. Seq. Length |
Avg. Seq. Length |
Avg. Mol. Weight |
|---|---|---|---|---|---|---|---|
0 |
1928892 |
29 |
6588 |
315.0 |
33.68 |
Amino acid frequency
Ala |
Cys |
Asp |
Glu |
Phe |
Gly |
His |
Ile |
Lys |
Leu |
|---|---|---|---|---|---|---|---|---|---|
13.938 ± 0.046 | 0.805 ± 0.011 |
6.252 ± 0.023 | 5.382 ± 0.028 |
2.782 ± 0.016 | 9.064 ± 0.035 |
2.28 ± 0.017 | 3.273 ± 0.022 |
2.009 ± 0.023 | 10.315 ± 0.036 |
Met |
Asn |
Gln |
Pro |
Arg |
Ser |
Thr |
Val |
Trp |
Tyr |
|---|---|---|---|---|---|---|---|---|---|
1.663 ± 0.012 | 1.835 ± 0.016 |
6.169 ± 0.037 | 2.632 ± 0.016 |
8.165 ± 0.032 | 4.914 ± 0.021 |
6.047 ± 0.028 | 9.097 ± 0.03 |
1.512 ± 0.013 | 1.864 ± 0.013 |
Most of the basic statistics you can see at this page can be downloaded from this CSV file
Proteome-pI is available under Creative Commons Attribution-NoDerivs license, for more details see here
| Reference: Kozlowski LP. Proteome-pI 2.0: Proteome Isoelectric Point Database Update. Nucleic Acids Res. 2021, doi: 10.1093/nar/gkab944 | Contact: Lukasz P. Kozlowski |
