Rhodobacter sp. CACIA14H1
Taxonomy: cellular organisms; Bacteria; Proteobacteria; Alphaproteobacteria; Rhodobacterales; Rhodobacteraceae; Rhodobacter; unclassified Rhodobacter
Average proteome isoelectric point is 6.47
Get precalculated fractions of proteins

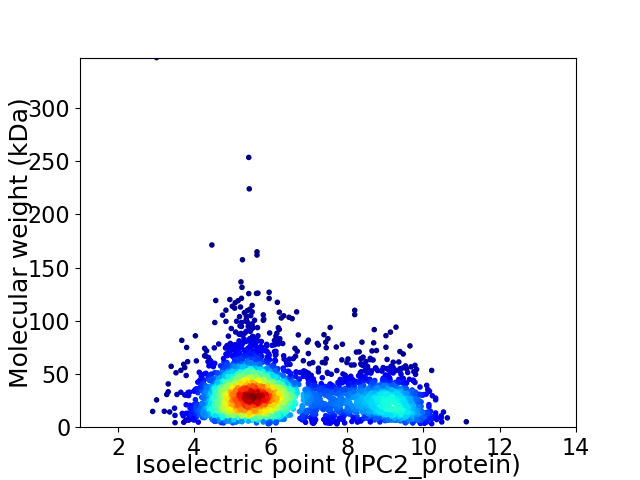
Virtual 2D-PAGE plot for 3570 proteins (isoelectric point calculated using IPC2_protein)
Get csv file with sequences according to given criteria:
* You can choose from 21 different methods for calculating isoelectric point
Summary statistics related to proteome-wise predictions


Protein with the lowest isoelectric point:
>tr|V7EJG3|V7EJG3_9RHOB Uncharacterized protein OS=Rhodobacter sp. CACIA14H1 OX=1408890 GN=Q27BPR15_13750 PE=4 SV=1
MM1 pKa = 7.77LFLLLAAFGLPANALNLSGASVEE24 pKa = 5.16LIYY27 pKa = 10.86SDD29 pKa = 3.87FGSYY33 pKa = 10.32GSAPVGSGVEE43 pKa = 3.87FDD45 pKa = 4.15EE46 pKa = 5.49GFGALTYY53 pKa = 10.88DD54 pKa = 3.71VDD56 pKa = 4.0PANNTVTLHH65 pKa = 6.74LSNSNPWGDD74 pKa = 3.45TTATLRR80 pKa = 11.84FSGGSVTDD88 pKa = 3.96FTSVAVTSNTTGQTYY103 pKa = 7.37TASVSGKK110 pKa = 10.02DD111 pKa = 3.56LVITLPVNSGAGDD124 pKa = 3.58VMFTLSDD131 pKa = 3.66TPLDD135 pKa = 3.91TVQPTVTGLTASSGRR150 pKa = 11.84YY151 pKa = 9.59GIGQTVQVSVSFSEE165 pKa = 4.38VVYY168 pKa = 9.36VTGTPQLTLEE178 pKa = 4.32TGATDD183 pKa = 3.89RR184 pKa = 11.84VASYY188 pKa = 11.11LSGSGTSTLVFSYY201 pKa = 9.36TVQAGDD207 pKa = 3.25TAADD211 pKa = 3.8LDD213 pKa = 4.25YY214 pKa = 11.61VAINSLALNGGTIRR228 pKa = 11.84DD229 pKa = 3.65AASNNAVLVLPSPGAANSLGANANIIVDD257 pKa = 3.96GVVPTVSSVTSPTSNGTYY275 pKa = 8.7KK276 pKa = 10.53TGDD279 pKa = 3.7TISVVVNFSEE289 pKa = 4.57TVIVTGTPQLTLEE302 pKa = 4.44TGLTDD307 pKa = 4.15RR308 pKa = 11.84SASYY312 pKa = 11.11SSGSGTSALTFTYY325 pKa = 9.54TVQSGDD331 pKa = 3.11TTADD335 pKa = 3.34LDD337 pKa = 4.26YY338 pKa = 11.45VATNSLALNGGSIRR352 pKa = 11.84DD353 pKa = 3.57EE354 pKa = 4.51AGNNATLTLASPGAANSLGANRR376 pKa = 11.84NIVIDD381 pKa = 5.08AISPTVTSVTSTTANDD397 pKa = 3.74TYY399 pKa = 11.18KK400 pKa = 10.41IGDD403 pKa = 3.91VISISVNFSEE413 pKa = 4.7TVTVTGTPQLTLEE426 pKa = 4.32TGATDD431 pKa = 3.52RR432 pKa = 11.84VVNYY436 pKa = 10.43ASGSGTGTLVFSYY449 pKa = 9.2TVQAGDD455 pKa = 3.22QSADD459 pKa = 3.24LDD461 pKa = 4.35YY462 pKa = 11.58ASTAALALNGGTIRR476 pKa = 11.84DD477 pKa = 3.74AAGNAATLTLASPGSANSLGANKK500 pKa = 10.27NIVIDD505 pKa = 4.11GVRR508 pKa = 11.84PAVTSIAPAGSTFGGASSVTFSVTFSEE535 pKa = 4.97TVTGVTPDD543 pKa = 3.99DD544 pKa = 3.79FALTVTGTAAGTIVSVSHH562 pKa = 6.69SGTTSDD568 pKa = 3.54VTVGSISGDD577 pKa = 3.02GTLRR581 pKa = 11.84LDD583 pKa = 3.99LRR585 pKa = 11.84GSTDD589 pKa = 2.41ICC591 pKa = 4.89
MM1 pKa = 7.77LFLLLAAFGLPANALNLSGASVEE24 pKa = 5.16LIYY27 pKa = 10.86SDD29 pKa = 3.87FGSYY33 pKa = 10.32GSAPVGSGVEE43 pKa = 3.87FDD45 pKa = 4.15EE46 pKa = 5.49GFGALTYY53 pKa = 10.88DD54 pKa = 3.71VDD56 pKa = 4.0PANNTVTLHH65 pKa = 6.74LSNSNPWGDD74 pKa = 3.45TTATLRR80 pKa = 11.84FSGGSVTDD88 pKa = 3.96FTSVAVTSNTTGQTYY103 pKa = 7.37TASVSGKK110 pKa = 10.02DD111 pKa = 3.56LVITLPVNSGAGDD124 pKa = 3.58VMFTLSDD131 pKa = 3.66TPLDD135 pKa = 3.91TVQPTVTGLTASSGRR150 pKa = 11.84YY151 pKa = 9.59GIGQTVQVSVSFSEE165 pKa = 4.38VVYY168 pKa = 9.36VTGTPQLTLEE178 pKa = 4.32TGATDD183 pKa = 3.89RR184 pKa = 11.84VASYY188 pKa = 11.11LSGSGTSTLVFSYY201 pKa = 9.36TVQAGDD207 pKa = 3.25TAADD211 pKa = 3.8LDD213 pKa = 4.25YY214 pKa = 11.61VAINSLALNGGTIRR228 pKa = 11.84DD229 pKa = 3.65AASNNAVLVLPSPGAANSLGANANIIVDD257 pKa = 3.96GVVPTVSSVTSPTSNGTYY275 pKa = 8.7KK276 pKa = 10.53TGDD279 pKa = 3.7TISVVVNFSEE289 pKa = 4.57TVIVTGTPQLTLEE302 pKa = 4.44TGLTDD307 pKa = 4.15RR308 pKa = 11.84SASYY312 pKa = 11.11SSGSGTSALTFTYY325 pKa = 9.54TVQSGDD331 pKa = 3.11TTADD335 pKa = 3.34LDD337 pKa = 4.26YY338 pKa = 11.45VATNSLALNGGSIRR352 pKa = 11.84DD353 pKa = 3.57EE354 pKa = 4.51AGNNATLTLASPGAANSLGANRR376 pKa = 11.84NIVIDD381 pKa = 5.08AISPTVTSVTSTTANDD397 pKa = 3.74TYY399 pKa = 11.18KK400 pKa = 10.41IGDD403 pKa = 3.91VISISVNFSEE413 pKa = 4.7TVTVTGTPQLTLEE426 pKa = 4.32TGATDD431 pKa = 3.52RR432 pKa = 11.84VVNYY436 pKa = 10.43ASGSGTGTLVFSYY449 pKa = 9.2TVQAGDD455 pKa = 3.22QSADD459 pKa = 3.24LDD461 pKa = 4.35YY462 pKa = 11.58ASTAALALNGGTIRR476 pKa = 11.84DD477 pKa = 3.74AAGNAATLTLASPGSANSLGANKK500 pKa = 10.27NIVIDD505 pKa = 4.11GVRR508 pKa = 11.84PAVTSIAPAGSTFGGASSVTFSVTFSEE535 pKa = 4.97TVTGVTPDD543 pKa = 3.99DD544 pKa = 3.79FALTVTGTAAGTIVSVSHH562 pKa = 6.69SGTTSDD568 pKa = 3.54VTVGSISGDD577 pKa = 3.02GTLRR581 pKa = 11.84LDD583 pKa = 3.99LRR585 pKa = 11.84GSTDD589 pKa = 2.41ICC591 pKa = 4.89
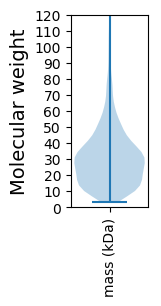
Molecular weight: 59.1 kDa
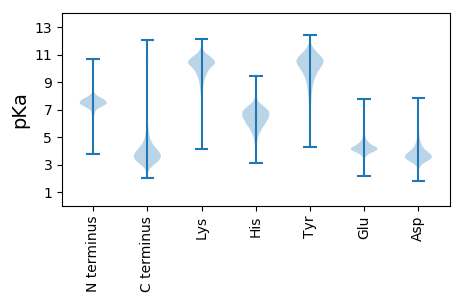
Isoelectric point according different methods:
Protein with the highest isoelectric point:
>tr|V7EI79|V7EI79_9RHOB DNA polymerase III subunit epsilon (Fragment) OS=Rhodobacter sp. CACIA14H1 OX=1408890 GN=Q27BPR15_14575 PE=4 SV=1
MM1 pKa = 7.35KK2 pKa = 9.44RR3 pKa = 11.84TYY5 pKa = 10.31QPSNLVRR12 pKa = 11.84KK13 pKa = 9.18RR14 pKa = 11.84RR15 pKa = 11.84HH16 pKa = 4.42GFRR19 pKa = 11.84ARR21 pKa = 11.84MATKK25 pKa = 10.34GGRR28 pKa = 11.84LVLAARR34 pKa = 11.84RR35 pKa = 11.84AKK37 pKa = 9.92GRR39 pKa = 11.84KK40 pKa = 8.91RR41 pKa = 11.84LSAA44 pKa = 3.96
MM1 pKa = 7.35KK2 pKa = 9.44RR3 pKa = 11.84TYY5 pKa = 10.31QPSNLVRR12 pKa = 11.84KK13 pKa = 9.18RR14 pKa = 11.84RR15 pKa = 11.84HH16 pKa = 4.42GFRR19 pKa = 11.84ARR21 pKa = 11.84MATKK25 pKa = 10.34GGRR28 pKa = 11.84LVLAARR34 pKa = 11.84RR35 pKa = 11.84AKK37 pKa = 9.92GRR39 pKa = 11.84KK40 pKa = 8.91RR41 pKa = 11.84LSAA44 pKa = 3.96
Molecular weight: 5.11 kDa
Isoelectric point according different methods:
Peptides (in silico digests for buttom-up proteomics)
Below you can find in silico digests of the whole proteome with Trypsin, Chymotrypsin, Trypsin+LysC, LysN, ArgC proteases suitable for different mass spec machines.| Try ESI |
 |
|---|
| ChTry ESI |
 |
|---|
| ArgC ESI |
 |
|---|
| LysN ESI |
 |
|---|
| TryLysC ESI |
 |
|---|
| Try MALDI |
 |
|---|
| ChTry MALDI |
 |
|---|
| ArgC MALDI |
 |
|---|
| LysN MALDI |
 |
|---|
| TryLysC MALDI |
 |
|---|
| Try LTQ |
 |
|---|
| ChTry LTQ |
 |
|---|
| ArgC LTQ |
 |
|---|
| LysN LTQ |
 |
|---|
| TryLysC LTQ |
 |
|---|
| Try MSlow |
 |
|---|
| ChTry MSlow |
 |
|---|
| ArgC MSlow |
 |
|---|
| LysN MSlow |
 |
|---|
| TryLysC MSlow |
 |
|---|
| Try MShigh |
 |
|---|
| ChTry MShigh |
 |
|---|
| ArgC MShigh |
 |
|---|
| LysN MShigh |
 |
|---|
| TryLysC MShigh |
 |
|---|
General Statistics
Number of major isoforms |
Number of additional isoforms |
Number of all proteins |
Number of amino acids |
Min. Seq. Length |
Max. Seq. Length |
Avg. Seq. Length |
Avg. Mol. Weight |
|---|---|---|---|---|---|---|---|
0 |
1060311 |
29 |
3616 |
297.0 |
32.0 |
Amino acid frequency
Ala |
Cys |
Asp |
Glu |
Phe |
Gly |
His |
Ile |
Lys |
Leu |
|---|---|---|---|---|---|---|---|---|---|
13.528 ± 0.065 | 0.871 ± 0.016 |
5.805 ± 0.052 | 5.464 ± 0.037 |
3.596 ± 0.028 | 9.212 ± 0.071 |
2.042 ± 0.022 | 4.68 ± 0.031 |
2.77 ± 0.037 | 10.292 ± 0.048 |
Met |
Asn |
Gln |
Pro |
Arg |
Ser |
Thr |
Val |
Trp |
Tyr |
|---|---|---|---|---|---|---|---|---|---|
2.735 ± 0.023 | 2.25 ± 0.024 |
5.379 ± 0.034 | 2.886 ± 0.022 |
7.228 ± 0.042 | 4.602 ± 0.024 |
5.485 ± 0.038 | 7.666 ± 0.041 |
1.473 ± 0.023 | 2.035 ± 0.021 |
Most of the basic statistics you can see at this page can be downloaded from this CSV file
Proteome-pI is available under Creative Commons Attribution-NoDerivs license, for more details see here
| Reference: Kozlowski LP. Proteome-pI 2.0: Proteome Isoelectric Point Database Update. Nucleic Acids Res. 2021, doi: 10.1093/nar/gkab944 | Contact: Lukasz P. Kozlowski |
