Vibrio phage PVA1
Taxonomy: Viruses; Duplodnaviria; Heunggongvirae; Uroviricota; Caudoviricetes; Caudovirales; Podoviridae; unclassified Podoviridae
Average proteome isoelectric point is 5.85
Get precalculated fractions of proteins

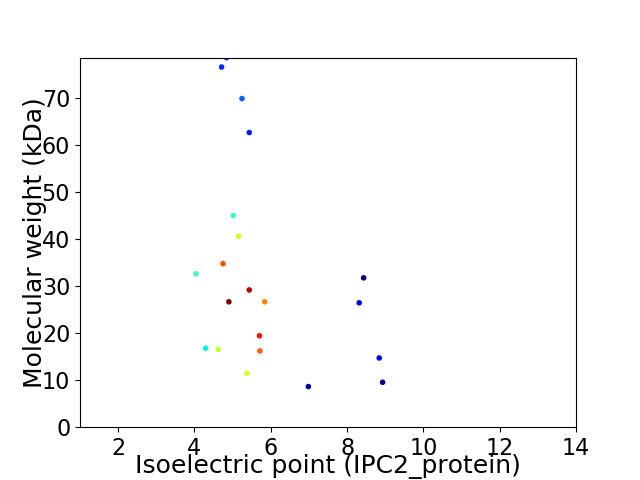
Virtual 2D-PAGE plot for 21 proteins (isoelectric point calculated using IPC2_protein)
Get csv file with sequences according to given criteria:
* You can choose from 21 different methods for calculating isoelectric point
Summary statistics related to proteome-wise predictions


Protein with the lowest isoelectric point:
>tr|W8EIS3|W8EIS3_9CAUD Endonuclease domain protein OS=Vibrio phage PVA1 OX=1461743 GN=PVA1_42 PE=4 SV=1
MM1 pKa = 7.78SDD3 pKa = 3.22TFRR6 pKa = 11.84KK7 pKa = 9.4VVNFPVGIKK16 pKa = 8.74KK17 pKa = 8.08TAVASAAADD26 pKa = 3.52VVNLGEE32 pKa = 4.2VQALVAGLNLAKK44 pKa = 10.31EE45 pKa = 4.27AVAVDD50 pKa = 3.18THH52 pKa = 7.3DD53 pKa = 5.19NIDD56 pKa = 3.78LATGGLIVIDD66 pKa = 5.17GYY68 pKa = 8.01QTIDD72 pKa = 3.36GDD74 pKa = 3.74RR75 pKa = 11.84VLVRR79 pKa = 11.84EE80 pKa = 4.28QTDD83 pKa = 3.2SSQNGIYY90 pKa = 9.77IASSGAWSRR99 pKa = 11.84ATDD102 pKa = 3.46ADD104 pKa = 3.65EE105 pKa = 4.72AAEE108 pKa = 4.27LKK110 pKa = 10.77AKK112 pKa = 10.21TSVTVLNGPHH122 pKa = 6.69SGRR125 pKa = 11.84KK126 pKa = 8.94YY127 pKa = 10.4EE128 pKa = 4.03LQEE131 pKa = 4.17DD132 pKa = 4.27QPVVGTDD139 pKa = 2.99AQTWIVTSASSSAAVDD155 pKa = 3.59TTVDD159 pKa = 3.14TTNFDD164 pKa = 4.42RR165 pKa = 11.84INPASSNAQSALDD178 pKa = 3.86SVDD181 pKa = 4.27DD182 pKa = 4.4LLVTITDD189 pKa = 3.83TVDD192 pKa = 3.62SINGAGAGAQDD203 pKa = 3.89YY204 pKa = 7.77GTFTGSTLSDD214 pKa = 3.38NASGKK219 pKa = 9.85ILFQEE224 pKa = 4.65LEE226 pKa = 4.23TAHH229 pKa = 6.09EE230 pKa = 4.07QLVTDD235 pKa = 4.57LANDD239 pKa = 3.66RR240 pKa = 11.84FEE242 pKa = 4.56STVTTLTTGSTITFTHH258 pKa = 6.9NIGTQFLSGLKK269 pKa = 9.85VYY271 pKa = 10.91NVVEE275 pKa = 4.3GANEE279 pKa = 5.05DD280 pKa = 3.3ITHH283 pKa = 6.6TVTIVAVDD291 pKa = 3.77GNNVTVQNDD300 pKa = 3.79GDD302 pKa = 4.06PVDD305 pKa = 4.04VVVVCAKK312 pKa = 10.57
MM1 pKa = 7.78SDD3 pKa = 3.22TFRR6 pKa = 11.84KK7 pKa = 9.4VVNFPVGIKK16 pKa = 8.74KK17 pKa = 8.08TAVASAAADD26 pKa = 3.52VVNLGEE32 pKa = 4.2VQALVAGLNLAKK44 pKa = 10.31EE45 pKa = 4.27AVAVDD50 pKa = 3.18THH52 pKa = 7.3DD53 pKa = 5.19NIDD56 pKa = 3.78LATGGLIVIDD66 pKa = 5.17GYY68 pKa = 8.01QTIDD72 pKa = 3.36GDD74 pKa = 3.74RR75 pKa = 11.84VLVRR79 pKa = 11.84EE80 pKa = 4.28QTDD83 pKa = 3.2SSQNGIYY90 pKa = 9.77IASSGAWSRR99 pKa = 11.84ATDD102 pKa = 3.46ADD104 pKa = 3.65EE105 pKa = 4.72AAEE108 pKa = 4.27LKK110 pKa = 10.77AKK112 pKa = 10.21TSVTVLNGPHH122 pKa = 6.69SGRR125 pKa = 11.84KK126 pKa = 8.94YY127 pKa = 10.4EE128 pKa = 4.03LQEE131 pKa = 4.17DD132 pKa = 4.27QPVVGTDD139 pKa = 2.99AQTWIVTSASSSAAVDD155 pKa = 3.59TTVDD159 pKa = 3.14TTNFDD164 pKa = 4.42RR165 pKa = 11.84INPASSNAQSALDD178 pKa = 3.86SVDD181 pKa = 4.27DD182 pKa = 4.4LLVTITDD189 pKa = 3.83TVDD192 pKa = 3.62SINGAGAGAQDD203 pKa = 3.89YY204 pKa = 7.77GTFTGSTLSDD214 pKa = 3.38NASGKK219 pKa = 9.85ILFQEE224 pKa = 4.65LEE226 pKa = 4.23TAHH229 pKa = 6.09EE230 pKa = 4.07QLVTDD235 pKa = 4.57LANDD239 pKa = 3.66RR240 pKa = 11.84FEE242 pKa = 4.56STVTTLTTGSTITFTHH258 pKa = 6.9NIGTQFLSGLKK269 pKa = 9.85VYY271 pKa = 10.91NVVEE275 pKa = 4.3GANEE279 pKa = 5.05DD280 pKa = 3.3ITHH283 pKa = 6.6TVTIVAVDD291 pKa = 3.77GNNVTVQNDD300 pKa = 3.79GDD302 pKa = 4.06PVDD305 pKa = 4.04VVVVCAKK312 pKa = 10.57
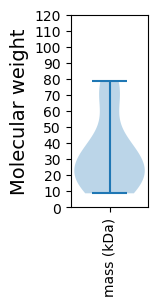
Molecular weight: 32.59 kDa
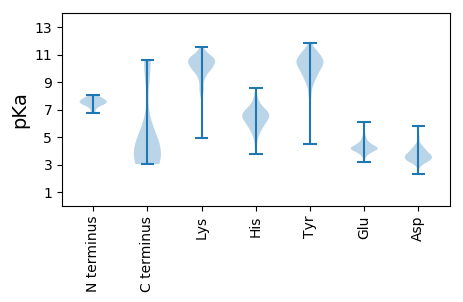
Isoelectric point according different methods:
Protein with the highest isoelectric point:
>tr|W8EIS8|W8EIS8_9CAUD Putative lysozyme family protein OS=Vibrio phage PVA1 OX=1461743 GN=PVA1_60 PE=4 SV=1
MM1 pKa = 6.75QQAADD6 pKa = 4.54EE7 pKa = 4.67IGLTYY12 pKa = 10.02NQVMYY17 pKa = 10.46IAGKK21 pKa = 9.29FKK23 pKa = 10.58ISFSHH28 pKa = 6.23KK29 pKa = 9.86GSRR32 pKa = 11.84HH33 pKa = 4.94YY34 pKa = 7.77MTKK37 pKa = 10.36LAEE40 pKa = 4.31CDD42 pKa = 3.08IPLIRR47 pKa = 11.84QLYY50 pKa = 9.18HH51 pKa = 6.89EE52 pKa = 4.91GTKK55 pKa = 10.28KK56 pKa = 10.23HH57 pKa = 5.62IIARR61 pKa = 11.84KK62 pKa = 8.68FDD64 pKa = 3.63VNVPVIEE71 pKa = 5.27KK72 pKa = 10.15ILSGANWSHH81 pKa = 5.62VKK83 pKa = 10.37
MM1 pKa = 6.75QQAADD6 pKa = 4.54EE7 pKa = 4.67IGLTYY12 pKa = 10.02NQVMYY17 pKa = 10.46IAGKK21 pKa = 9.29FKK23 pKa = 10.58ISFSHH28 pKa = 6.23KK29 pKa = 9.86GSRR32 pKa = 11.84HH33 pKa = 4.94YY34 pKa = 7.77MTKK37 pKa = 10.36LAEE40 pKa = 4.31CDD42 pKa = 3.08IPLIRR47 pKa = 11.84QLYY50 pKa = 9.18HH51 pKa = 6.89EE52 pKa = 4.91GTKK55 pKa = 10.28KK56 pKa = 10.23HH57 pKa = 5.62IIARR61 pKa = 11.84KK62 pKa = 8.68FDD64 pKa = 3.63VNVPVIEE71 pKa = 5.27KK72 pKa = 10.15ILSGANWSHH81 pKa = 5.62VKK83 pKa = 10.37
Molecular weight: 9.54 kDa
Isoelectric point according different methods:
Peptides (in silico digests for buttom-up proteomics)
Below you can find in silico digests of the whole proteome with Trypsin, Chymotrypsin, Trypsin+LysC, LysN, ArgC proteases suitable for different mass spec machines.| Try ESI |
 |
|---|
| ChTry ESI |
 |
|---|
| ArgC ESI |
 |
|---|
| LysN ESI |
 |
|---|
| TryLysC ESI |
 |
|---|
| Try MALDI |
 |
|---|
| ChTry MALDI |
 |
|---|
| ArgC MALDI |
 |
|---|
| LysN MALDI |
 |
|---|
| TryLysC MALDI |
 |
|---|
| Try LTQ |
 |
|---|
| ChTry LTQ |
 |
|---|
| ArgC LTQ |
 |
|---|
| LysN LTQ |
 |
|---|
| TryLysC LTQ |
 |
|---|
| Try MSlow |
 |
|---|
| ChTry MSlow |
 |
|---|
| ArgC MSlow |
 |
|---|
| LysN MSlow |
 |
|---|
| TryLysC MSlow |
 |
|---|
| Try MShigh |
 |
|---|
| ChTry MShigh |
 |
|---|
| ArgC MShigh |
 |
|---|
| LysN MShigh |
 |
|---|
| TryLysC MShigh |
 |
|---|
General Statistics
Number of major isoforms |
Number of additional isoforms |
Number of all proteins |
Number of amino acids |
Min. Seq. Length |
Max. Seq. Length |
Avg. Seq. Length |
Avg. Mol. Weight |
|---|---|---|---|---|---|---|---|
0 |
6223 |
72 |
694 |
296.3 |
33.05 |
Amino acid frequency
Ala |
Cys |
Asp |
Glu |
Phe |
Gly |
His |
Ile |
Lys |
Leu |
|---|---|---|---|---|---|---|---|---|---|
8.645 ± 0.699 | 1.012 ± 0.191 |
6.942 ± 0.317 | 7.183 ± 0.486 |
3.375 ± 0.262 | 6.926 ± 0.465 |
1.398 ± 0.212 | 5.415 ± 0.197 |
7.087 ± 0.52 | 7.504 ± 0.246 |
Met |
Asn |
Gln |
Pro |
Arg |
Ser |
Thr |
Val |
Trp |
Tyr |
|---|---|---|---|---|---|---|---|---|---|
2.989 ± 0.357 | 5.431 ± 0.354 |
3.567 ± 0.272 | 4.644 ± 0.373 |
4.516 ± 0.29 | 6.749 ± 0.293 |
5.769 ± 0.467 | 5.93 ± 0.493 |
1.269 ± 0.173 | 3.648 ± 0.411 |
Most of the basic statistics you can see at this page can be downloaded from this CSV file
Proteome-pI is available under Creative Commons Attribution-NoDerivs license, for more details see here
| Reference: Kozlowski LP. Proteome-pI 2.0: Proteome Isoelectric Point Database Update. Nucleic Acids Res. 2021, doi: 10.1093/nar/gkab944 | Contact: Lukasz P. Kozlowski |
