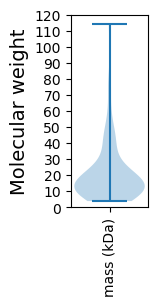
Streptomyces phage Bowden
Taxonomy: Viruses; Duplodnaviria; Heunggongvirae; Uroviricota; Caudoviricetes; Caudovirales; Siphoviridae; Arquatrovirinae; Arequatrovirus; unclassified Arequatrovirus
Average proteome isoelectric point is 5.95
Get precalculated fractions of proteins

Virtual 2D-PAGE plot for 81 proteins (isoelectric point calculated using IPC2_protein)
Get csv file with sequences according to given criteria:
* You can choose from 21 different methods for calculating isoelectric point
Summary statistics related to proteome-wise predictions


Protein with the lowest isoelectric point:
>tr|A0A411CP07|A0A411CP07_9CAUD Minor tail protein OS=Streptomyces phage Bowden OX=2510524 GN=21 PE=4 SV=1
MM1 pKa = 7.75ALNDD5 pKa = 3.72AATLVIGSGNYY16 pKa = 7.79LTAPVGTDD24 pKa = 2.71IPTDD28 pKa = 3.63LLVPVSPWEE37 pKa = 4.27AVGHH41 pKa = 5.85TSLEE45 pKa = 4.62DD46 pKa = 3.09IFSIASEE53 pKa = 4.21GGEE56 pKa = 3.82ATVIGSLQNKK66 pKa = 7.32SLRR69 pKa = 11.84TKK71 pKa = 10.19YY72 pKa = 10.01SARR75 pKa = 11.84TEE77 pKa = 4.14TMAFTLQQFDD87 pKa = 3.92VKK89 pKa = 10.73GLKK92 pKa = 9.98LYY94 pKa = 10.4YY95 pKa = 10.42GSNAPILPDD104 pKa = 3.49GSVGVPADD112 pKa = 3.93PVPTTAAFLAVFVDD126 pKa = 4.2GEE128 pKa = 4.59NVFAFYY134 pKa = 10.79APKK137 pKa = 10.81AEE139 pKa = 4.35IYY141 pKa = 10.76RR142 pKa = 11.84NDD144 pKa = 3.94DD145 pKa = 3.38LSFGDD150 pKa = 3.96TEE152 pKa = 4.6SLAGLPIGVKK162 pKa = 10.18PMTYY166 pKa = 10.33GANSWTYY173 pKa = 11.09AITPLGTVSATGATAGTPGSFTPAGSTAPYY203 pKa = 10.82DD204 pKa = 4.58LVDD207 pKa = 4.94LDD209 pKa = 5.83LVTADD214 pKa = 4.91PATAWTTGQYY224 pKa = 10.36VVLGDD229 pKa = 4.16GSNASWNGTDD239 pKa = 3.04WVEE242 pKa = 4.94GIAAA246 pKa = 4.47
MM1 pKa = 7.75ALNDD5 pKa = 3.72AATLVIGSGNYY16 pKa = 7.79LTAPVGTDD24 pKa = 2.71IPTDD28 pKa = 3.63LLVPVSPWEE37 pKa = 4.27AVGHH41 pKa = 5.85TSLEE45 pKa = 4.62DD46 pKa = 3.09IFSIASEE53 pKa = 4.21GGEE56 pKa = 3.82ATVIGSLQNKK66 pKa = 7.32SLRR69 pKa = 11.84TKK71 pKa = 10.19YY72 pKa = 10.01SARR75 pKa = 11.84TEE77 pKa = 4.14TMAFTLQQFDD87 pKa = 3.92VKK89 pKa = 10.73GLKK92 pKa = 9.98LYY94 pKa = 10.4YY95 pKa = 10.42GSNAPILPDD104 pKa = 3.49GSVGVPADD112 pKa = 3.93PVPTTAAFLAVFVDD126 pKa = 4.2GEE128 pKa = 4.59NVFAFYY134 pKa = 10.79APKK137 pKa = 10.81AEE139 pKa = 4.35IYY141 pKa = 10.76RR142 pKa = 11.84NDD144 pKa = 3.94DD145 pKa = 3.38LSFGDD150 pKa = 3.96TEE152 pKa = 4.6SLAGLPIGVKK162 pKa = 10.18PMTYY166 pKa = 10.33GANSWTYY173 pKa = 11.09AITPLGTVSATGATAGTPGSFTPAGSTAPYY203 pKa = 10.82DD204 pKa = 4.58LVDD207 pKa = 4.94LDD209 pKa = 5.83LVTADD214 pKa = 4.91PATAWTTGQYY224 pKa = 10.36VVLGDD229 pKa = 4.16GSNASWNGTDD239 pKa = 3.04WVEE242 pKa = 4.94GIAAA246 pKa = 4.47
Molecular weight: 25.46 kDa
Isoelectric point according different methods:
Protein with the highest isoelectric point:
>tr|A0A411CPP8|A0A411CPP8_9CAUD Tail terminator OS=Streptomyces phage Bowden OX=2510524 GN=15 PE=4 SV=1
MM1 pKa = 7.05NAKK4 pKa = 9.22EE5 pKa = 4.06LRR7 pKa = 11.84EE8 pKa = 4.02AQQAGRR14 pKa = 11.84RR15 pKa = 11.84IEE17 pKa = 4.4GAVPPAVGRR26 pKa = 11.84EE27 pKa = 3.76MEE29 pKa = 4.0YY30 pKa = 10.49RR31 pKa = 11.84PRR33 pKa = 11.84RR34 pKa = 11.84KK35 pKa = 8.22TDD37 pKa = 3.25ALPWIEE43 pKa = 4.56KK44 pKa = 10.04GQVHH48 pKa = 6.68DD49 pKa = 3.53WARR52 pKa = 11.84YY53 pKa = 7.39RR54 pKa = 11.84SRR56 pKa = 11.84EE57 pKa = 3.67VRR59 pKa = 11.84AAA61 pKa = 3.28
MM1 pKa = 7.05NAKK4 pKa = 9.22EE5 pKa = 4.06LRR7 pKa = 11.84EE8 pKa = 4.02AQQAGRR14 pKa = 11.84RR15 pKa = 11.84IEE17 pKa = 4.4GAVPPAVGRR26 pKa = 11.84EE27 pKa = 3.76MEE29 pKa = 4.0YY30 pKa = 10.49RR31 pKa = 11.84PRR33 pKa = 11.84RR34 pKa = 11.84KK35 pKa = 8.22TDD37 pKa = 3.25ALPWIEE43 pKa = 4.56KK44 pKa = 10.04GQVHH48 pKa = 6.68DD49 pKa = 3.53WARR52 pKa = 11.84YY53 pKa = 7.39RR54 pKa = 11.84SRR56 pKa = 11.84EE57 pKa = 3.67VRR59 pKa = 11.84AAA61 pKa = 3.28
Molecular weight: 7.15 kDa
Isoelectric point according different methods:
Peptides (in silico digests for buttom-up proteomics)
Below you can find in silico digests of the whole proteome with Trypsin, Chymotrypsin, Trypsin+LysC, LysN, ArgC proteases suitable for different mass spec machines.| Try ESI |
 |
|---|
| ChTry ESI |
 |
|---|
| ArgC ESI |
 |
|---|
| LysN ESI |
 |
|---|
| TryLysC ESI |
 |
|---|
| Try MALDI |
 |
|---|
| ChTry MALDI |
 |
|---|
| ArgC MALDI |
 |
|---|
| LysN MALDI |
 |
|---|
| TryLysC MALDI |
 |
|---|
| Try LTQ |
 |
|---|
| ChTry LTQ |
 |
|---|
| ArgC LTQ |
 |
|---|
| LysN LTQ |
 |
|---|
| TryLysC LTQ |
 |
|---|
| Try MSlow |
 |
|---|
| ChTry MSlow |
 |
|---|
| ArgC MSlow |
 |
|---|
| LysN MSlow |
 |
|---|
| TryLysC MSlow |
 |
|---|
| Try MShigh |
 |
|---|
| ChTry MShigh |
 |
|---|
| ArgC MShigh |
 |
|---|
| LysN MShigh |
 |
|---|
| TryLysC MShigh |
 |
|---|
General Statistics
Number of major isoforms |
Number of additional isoforms |
Number of all proteins |
Number of amino acids |
Min. Seq. Length |
Max. Seq. Length |
Avg. Seq. Length |
Avg. Mol. Weight |
|---|---|---|---|---|---|---|---|
0 |
15645 |
34 |
1086 |
193.1 |
21.15 |
Amino acid frequency
Ala |
Cys |
Asp |
Glu |
Phe |
Gly |
His |
Ile |
Lys |
Leu |
|---|---|---|---|---|---|---|---|---|---|
11.473 ± 0.368 | 0.697 ± 0.124 |
6.494 ± 0.251 | 6.954 ± 0.395 |
3.036 ± 0.193 | 8.392 ± 0.301 |
2.128 ± 0.208 | 4.072 ± 0.278 |
4.551 ± 0.263 | 8.418 ± 0.355 |
Met |
Asn |
Gln |
Pro |
Arg |
Ser |
Thr |
Val |
Trp |
Tyr |
|---|---|---|---|---|---|---|---|---|---|
2.097 ± 0.131 | 2.787 ± 0.14 |
4.756 ± 0.196 | 3.343 ± 0.149 |
6.411 ± 0.354 | 5.797 ± 0.275 |
6.462 ± 0.279 | 7.389 ± 0.269 |
1.93 ± 0.123 | 2.812 ± 0.198 |
Most of the basic statistics you can see at this page can be downloaded from this CSV file
Proteome-pI is available under Creative Commons Attribution-NoDerivs license, for more details see here
| Reference: Kozlowski LP. Proteome-pI 2.0: Proteome Isoelectric Point Database Update. Nucleic Acids Res. 2021, doi: 10.1093/nar/gkab944 | Contact: Lukasz P. Kozlowski |
