Neurospora tetrasperma (strain FGSC 2509 / P0656)
Taxonomy: cellular organisms; Eukaryota; Opisthokonta; Fungi; Dikarya; Ascomycota; saccharomyceta; Pezizomycotina; leotiomyceta; sordariomyceta; Sordariomycetes; Sordariomycetidae; Sordariales; Sordariaceae; Neurospora; Neurospora tetrasperma
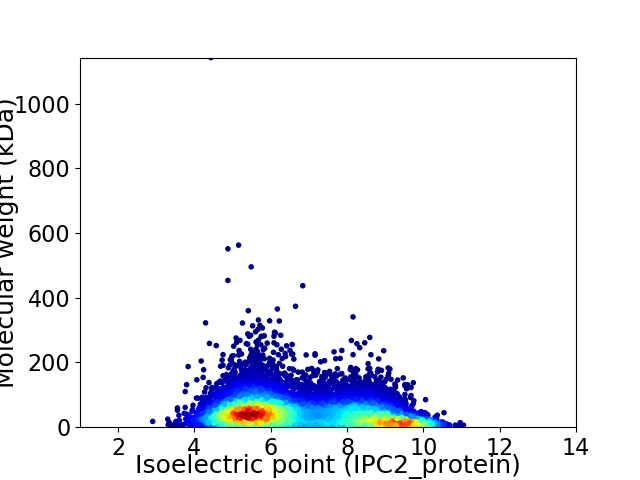
Average proteome isoelectric point is 6.79
Get precalculated fractions of proteins

Virtual 2D-PAGE plot for 11177 proteins (isoelectric point calculated using IPC2_protein)
Get csv file with sequences according to given criteria:
* You can choose from 21 different methods for calculating isoelectric point
Summary statistics related to proteome-wise predictions


Protein with the lowest isoelectric point:
>tr|G4UPZ8|G4UPZ8_NEUT9 Uncharacterized protein OS=Neurospora tetrasperma (strain FGSC 2509 / P0656) OX=510952 GN=NEUTE2DRAFT_139498 PE=4 SV=1
MM1 pKa = 7.57ANEE4 pKa = 3.97QSMPLPLVDD13 pKa = 3.3EE14 pKa = 5.21RR15 pKa = 11.84NRR17 pKa = 11.84KK18 pKa = 8.31MLDD21 pKa = 3.75AIHH24 pKa = 6.45NAPCMSLQIVLFSLYY39 pKa = 10.99AEE41 pKa = 4.92GDD43 pKa = 3.9DD44 pKa = 3.89NLKK47 pKa = 9.06TRR49 pKa = 11.84IEE51 pKa = 4.42DD52 pKa = 3.6LVHH55 pKa = 7.49DD56 pKa = 4.38YY57 pKa = 10.86TLTLHH62 pKa = 6.6NLDD65 pKa = 4.68AGIATPASEE74 pKa = 5.19LRR76 pKa = 11.84TEE78 pKa = 4.46PATEE82 pKa = 4.01VPLATEE88 pKa = 4.21EE89 pKa = 4.32PVDD92 pKa = 3.56NTIYY96 pKa = 11.0CPVCDD101 pKa = 5.89DD102 pKa = 4.44YY103 pKa = 11.86FDD105 pKa = 6.11PDD107 pKa = 5.63DD108 pKa = 5.0EE109 pKa = 7.23DD110 pKa = 4.95DD111 pKa = 4.5LCFHH115 pKa = 7.06HH116 pKa = 7.08PGKK119 pKa = 10.64RR120 pKa = 11.84IAIPGFDD127 pKa = 2.84SVAYY131 pKa = 8.62EE132 pKa = 4.26KK133 pKa = 10.65EE134 pKa = 4.28VSPEE138 pKa = 3.44AYY140 pKa = 9.54QIKK143 pKa = 10.04VEE145 pKa = 4.22EE146 pKa = 4.49GLDD149 pKa = 3.54TEE151 pKa = 4.54EE152 pKa = 4.5NRR154 pKa = 11.84LVPLWASTWDD164 pKa = 3.41CCGGVGASRR173 pKa = 11.84GCVQGVHH180 pKa = 4.84VEE182 pKa = 4.19YY183 pKa = 11.21VEE185 pKa = 5.9GMEE188 pKa = 5.25DD189 pKa = 3.39WDD191 pKa = 5.22DD192 pKa = 4.04SDD194 pKa = 5.26SSSSDD199 pKa = 3.31EE200 pKa = 4.34SDD202 pKa = 3.02SDD204 pKa = 3.6
MM1 pKa = 7.57ANEE4 pKa = 3.97QSMPLPLVDD13 pKa = 3.3EE14 pKa = 5.21RR15 pKa = 11.84NRR17 pKa = 11.84KK18 pKa = 8.31MLDD21 pKa = 3.75AIHH24 pKa = 6.45NAPCMSLQIVLFSLYY39 pKa = 10.99AEE41 pKa = 4.92GDD43 pKa = 3.9DD44 pKa = 3.89NLKK47 pKa = 9.06TRR49 pKa = 11.84IEE51 pKa = 4.42DD52 pKa = 3.6LVHH55 pKa = 7.49DD56 pKa = 4.38YY57 pKa = 10.86TLTLHH62 pKa = 6.6NLDD65 pKa = 4.68AGIATPASEE74 pKa = 5.19LRR76 pKa = 11.84TEE78 pKa = 4.46PATEE82 pKa = 4.01VPLATEE88 pKa = 4.21EE89 pKa = 4.32PVDD92 pKa = 3.56NTIYY96 pKa = 11.0CPVCDD101 pKa = 5.89DD102 pKa = 4.44YY103 pKa = 11.86FDD105 pKa = 6.11PDD107 pKa = 5.63DD108 pKa = 5.0EE109 pKa = 7.23DD110 pKa = 4.95DD111 pKa = 4.5LCFHH115 pKa = 7.06HH116 pKa = 7.08PGKK119 pKa = 10.64RR120 pKa = 11.84IAIPGFDD127 pKa = 2.84SVAYY131 pKa = 8.62EE132 pKa = 4.26KK133 pKa = 10.65EE134 pKa = 4.28VSPEE138 pKa = 3.44AYY140 pKa = 9.54QIKK143 pKa = 10.04VEE145 pKa = 4.22EE146 pKa = 4.49GLDD149 pKa = 3.54TEE151 pKa = 4.54EE152 pKa = 4.5NRR154 pKa = 11.84LVPLWASTWDD164 pKa = 3.41CCGGVGASRR173 pKa = 11.84GCVQGVHH180 pKa = 4.84VEE182 pKa = 4.19YY183 pKa = 11.21VEE185 pKa = 5.9GMEE188 pKa = 5.25DD189 pKa = 3.39WDD191 pKa = 5.22DD192 pKa = 4.04SDD194 pKa = 5.26SSSSDD199 pKa = 3.31EE200 pKa = 4.34SDD202 pKa = 3.02SDD204 pKa = 3.6
Molecular weight: 22.66 kDa
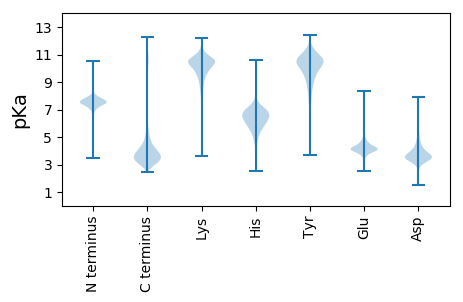
Isoelectric point according different methods:
Protein with the highest isoelectric point:
>tr|G4V1S4|G4V1S4_NEUT9 AMPK1_CBM domain-containing protein OS=Neurospora tetrasperma (strain FGSC 2509 / P0656) OX=510952 GN=NEUTE2DRAFT_160384 PE=4 SV=1
VV1 pKa = 6.8RR2 pKa = 11.84AILRR6 pKa = 11.84VLKK9 pKa = 10.49RR10 pKa = 11.84RR11 pKa = 11.84NFVGKK16 pKa = 9.94NGNFNIRR23 pKa = 11.84CHH25 pKa = 5.21QLNRR29 pKa = 11.84PSFLVGVRR37 pKa = 11.84TWRR40 pKa = 11.84FLVRR44 pKa = 11.84AGRR47 pKa = 11.84LTLSKK52 pKa = 10.23KK53 pKa = 10.66APLFRR58 pKa = 11.84PRR60 pKa = 11.84KK61 pKa = 7.15TVGG64 pKa = 2.81
VV1 pKa = 6.8RR2 pKa = 11.84AILRR6 pKa = 11.84VLKK9 pKa = 10.49RR10 pKa = 11.84RR11 pKa = 11.84NFVGKK16 pKa = 9.94NGNFNIRR23 pKa = 11.84CHH25 pKa = 5.21QLNRR29 pKa = 11.84PSFLVGVRR37 pKa = 11.84TWRR40 pKa = 11.84FLVRR44 pKa = 11.84AGRR47 pKa = 11.84LTLSKK52 pKa = 10.23KK53 pKa = 10.66APLFRR58 pKa = 11.84PRR60 pKa = 11.84KK61 pKa = 7.15TVGG64 pKa = 2.81
Molecular weight: 7.49 kDa
Isoelectric point according different methods:
Peptides (in silico digests for buttom-up proteomics)
Below you can find in silico digests of the whole proteome with Trypsin, Chymotrypsin, Trypsin+LysC, LysN, ArgC proteases suitable for different mass spec machines.| Try ESI |
 |
|---|
| ChTry ESI |
 |
|---|
| ArgC ESI |
 |
|---|
| LysN ESI |
 |
|---|
| TryLysC ESI |
 |
|---|
| Try MALDI |
 |
|---|
| ChTry MALDI |
 |
|---|
| ArgC MALDI |
 |
|---|
| LysN MALDI |
 |
|---|
| TryLysC MALDI |
 |
|---|
| Try LTQ |
 |
|---|
| ChTry LTQ |
 |
|---|
| ArgC LTQ |
 |
|---|
| LysN LTQ |
 |
|---|
| TryLysC LTQ |
 |
|---|
| Try MSlow |
 |
|---|
| ChTry MSlow |
 |
|---|
| ArgC MSlow |
 |
|---|
| LysN MSlow |
 |
|---|
| TryLysC MSlow |
 |
|---|
| Try MShigh |
 |
|---|
| ChTry MShigh |
 |
|---|
| ArgC MShigh |
 |
|---|
| LysN MShigh |
 |
|---|
| TryLysC MShigh |
 |
|---|
General Statistics
Number of major isoforms |
Number of additional isoforms |
Number of all proteins |
Number of amino acids |
Min. Seq. Length |
Max. Seq. Length |
Avg. Seq. Length |
Avg. Mol. Weight |
|---|---|---|---|---|---|---|---|
0 |
4951514 |
49 |
10513 |
443.0 |
48.89 |
Amino acid frequency
Ala |
Cys |
Asp |
Glu |
Phe |
Gly |
His |
Ile |
Lys |
Leu |
|---|---|---|---|---|---|---|---|---|---|
8.601 ± 0.023 | 1.173 ± 0.01 |
5.604 ± 0.017 | 6.39 ± 0.029 |
3.426 ± 0.014 | 7.164 ± 0.027 |
2.475 ± 0.013 | 4.493 ± 0.016 |
5.075 ± 0.023 | 8.413 ± 0.029 |
Met |
Asn |
Gln |
Pro |
Arg |
Ser |
Thr |
Val |
Trp |
Tyr |
|---|---|---|---|---|---|---|---|---|---|
2.155 ± 0.01 | 3.718 ± 0.015 |
6.501 ± 0.027 | 4.207 ± 0.025 |
6.211 ± 0.022 | 8.281 ± 0.03 |
6.124 ± 0.018 | 6.002 ± 0.015 |
1.386 ± 0.009 | 2.601 ± 0.012 |
Most of the basic statistics you can see at this page can be downloaded from this CSV file
Proteome-pI is available under Creative Commons Attribution-NoDerivs license, for more details see here
| Reference: Kozlowski LP. Proteome-pI 2.0: Proteome Isoelectric Point Database Update. Nucleic Acids Res. 2021, doi: 10.1093/nar/gkab944 | Contact: Lukasz P. Kozlowski |
