Rhodopseudomonas palustris
Taxonomy: cellular organisms; Bacteria; Proteobacteria; Alphaproteobacteria; Rhizobiales; Bradyrhizobiaceae; Rhodopseudomonas
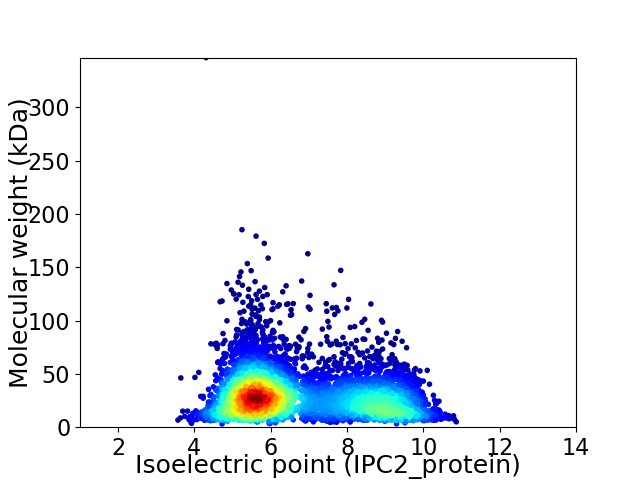
Average proteome isoelectric point is 6.76
Get precalculated fractions of proteins

Virtual 2D-PAGE plot for 5580 proteins (isoelectric point calculated using IPC2_protein)
Get csv file with sequences according to given criteria:
* You can choose from 21 different methods for calculating isoelectric point
Summary statistics related to proteome-wise predictions


Protein with the lowest isoelectric point:
>tr|A0A0D7EU90|A0A0D7EU90_RHOPL Photosystem reaction center subunit H OS=Rhodopseudomonas palustris OX=1076 GN=OO17_09930 PE=4 SV=1
MM1 pKa = 7.34TISVTEE7 pKa = 4.8AIEE10 pKa = 3.99QNTKK14 pKa = 10.28GMSDD18 pKa = 4.01GLPVGVPASYY28 pKa = 10.19SWYY31 pKa = 8.55TGAVSDD37 pKa = 5.12SDD39 pKa = 3.77IPPADD44 pKa = 3.99FSSVGGWGQIYY55 pKa = 9.81PEE57 pKa = 4.19QGSSYY62 pKa = 10.45SNPNATVEE70 pKa = 4.25VANAQTWVHH79 pKa = 6.78LSTTNQWVLVQSQANDD95 pKa = 3.9PLEE98 pKa = 4.62GGHH101 pKa = 6.17FVADD105 pKa = 4.24FAGNAGIGMEE115 pKa = 4.3VTQGADD121 pKa = 3.09GTATMEE127 pKa = 4.28VPPLGYY133 pKa = 9.85NDD135 pKa = 4.75HH136 pKa = 6.66FWHH139 pKa = 6.53VGRR142 pKa = 11.84GQFAPGTVDD151 pKa = 3.25GVYY154 pKa = 10.5VQMDD158 pKa = 3.81MKK160 pKa = 10.84ISDD163 pKa = 4.28PNVKK167 pKa = 10.05AVANIGADD175 pKa = 2.9WWRR178 pKa = 11.84TPTADD183 pKa = 3.63YY184 pKa = 11.59VDD186 pKa = 4.22GFGNNPGAGMSNWVEE201 pKa = 3.84LTGDD205 pKa = 3.7YY206 pKa = 8.0QTLAFYY212 pKa = 10.78SGTAAEE218 pKa = 5.06FRR220 pKa = 11.84ADD222 pKa = 4.28PPPCCTDD229 pKa = 4.99AIITNPNPPVTDD241 pKa = 3.79PPGGIGTDD249 pKa = 3.63TPIVIPPGSTPDD261 pKa = 3.47PVVGVNLLKK270 pKa = 10.95NGSFEE275 pKa = 4.11ATPVGSGQAGIQTQINGWTALSGSAIEE302 pKa = 4.38LWNNLGGVQATEE314 pKa = 3.99GNNFVEE320 pKa = 4.52LDD322 pKa = 3.49YY323 pKa = 11.23MGAQDD328 pKa = 5.07GFSQSVQTSSGQALTLSVDD347 pKa = 2.66ARR349 pKa = 11.84TRR351 pKa = 11.84PGEE354 pKa = 3.91NPYY357 pKa = 10.61SCGVEE362 pKa = 3.98VLWNGEE368 pKa = 4.41VISTIQPGADD378 pKa = 2.43WSTYY382 pKa = 8.17SVNVTGTGGNDD393 pKa = 3.0TLTIRR398 pKa = 11.84EE399 pKa = 4.26PQNQAFDD406 pKa = 3.99GVGAMLDD413 pKa = 3.85NLKK416 pKa = 10.45LAANTASTPTDD427 pKa = 3.53DD428 pKa = 4.2TDD430 pKa = 5.28LPSTDD435 pKa = 3.85PTPGGSGTDD444 pKa = 3.14
MM1 pKa = 7.34TISVTEE7 pKa = 4.8AIEE10 pKa = 3.99QNTKK14 pKa = 10.28GMSDD18 pKa = 4.01GLPVGVPASYY28 pKa = 10.19SWYY31 pKa = 8.55TGAVSDD37 pKa = 5.12SDD39 pKa = 3.77IPPADD44 pKa = 3.99FSSVGGWGQIYY55 pKa = 9.81PEE57 pKa = 4.19QGSSYY62 pKa = 10.45SNPNATVEE70 pKa = 4.25VANAQTWVHH79 pKa = 6.78LSTTNQWVLVQSQANDD95 pKa = 3.9PLEE98 pKa = 4.62GGHH101 pKa = 6.17FVADD105 pKa = 4.24FAGNAGIGMEE115 pKa = 4.3VTQGADD121 pKa = 3.09GTATMEE127 pKa = 4.28VPPLGYY133 pKa = 9.85NDD135 pKa = 4.75HH136 pKa = 6.66FWHH139 pKa = 6.53VGRR142 pKa = 11.84GQFAPGTVDD151 pKa = 3.25GVYY154 pKa = 10.5VQMDD158 pKa = 3.81MKK160 pKa = 10.84ISDD163 pKa = 4.28PNVKK167 pKa = 10.05AVANIGADD175 pKa = 2.9WWRR178 pKa = 11.84TPTADD183 pKa = 3.63YY184 pKa = 11.59VDD186 pKa = 4.22GFGNNPGAGMSNWVEE201 pKa = 3.84LTGDD205 pKa = 3.7YY206 pKa = 8.0QTLAFYY212 pKa = 10.78SGTAAEE218 pKa = 5.06FRR220 pKa = 11.84ADD222 pKa = 4.28PPPCCTDD229 pKa = 4.99AIITNPNPPVTDD241 pKa = 3.79PPGGIGTDD249 pKa = 3.63TPIVIPPGSTPDD261 pKa = 3.47PVVGVNLLKK270 pKa = 10.95NGSFEE275 pKa = 4.11ATPVGSGQAGIQTQINGWTALSGSAIEE302 pKa = 4.38LWNNLGGVQATEE314 pKa = 3.99GNNFVEE320 pKa = 4.52LDD322 pKa = 3.49YY323 pKa = 11.23MGAQDD328 pKa = 5.07GFSQSVQTSSGQALTLSVDD347 pKa = 2.66ARR349 pKa = 11.84TRR351 pKa = 11.84PGEE354 pKa = 3.91NPYY357 pKa = 10.61SCGVEE362 pKa = 3.98VLWNGEE368 pKa = 4.41VISTIQPGADD378 pKa = 2.43WSTYY382 pKa = 8.17SVNVTGTGGNDD393 pKa = 3.0TLTIRR398 pKa = 11.84EE399 pKa = 4.26PQNQAFDD406 pKa = 3.99GVGAMLDD413 pKa = 3.85NLKK416 pKa = 10.45LAANTASTPTDD427 pKa = 3.53DD428 pKa = 4.2TDD430 pKa = 5.28LPSTDD435 pKa = 3.85PTPGGSGTDD444 pKa = 3.14
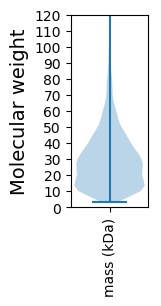
Molecular weight: 46.2 kDa
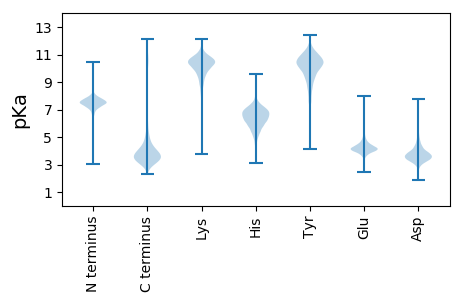
Isoelectric point according different methods:
Protein with the highest isoelectric point:
>tr|A0A0D7E3J2|A0A0D7E3J2_RHOPL Uncharacterized protein OS=Rhodopseudomonas palustris OX=1076 GN=OO17_25755 PE=4 SV=1
MM1 pKa = 6.88TTFLSSILLPVLVGAVTLVLLLGLINMMRR30 pKa = 11.84GGSPNRR36 pKa = 11.84SQTLMRR42 pKa = 11.84WRR44 pKa = 11.84VLLQFAAIIVTMLAVWAMGRR64 pKa = 3.49
MM1 pKa = 6.88TTFLSSILLPVLVGAVTLVLLLGLINMMRR30 pKa = 11.84GGSPNRR36 pKa = 11.84SQTLMRR42 pKa = 11.84WRR44 pKa = 11.84VLLQFAAIIVTMLAVWAMGRR64 pKa = 3.49
Molecular weight: 7.04 kDa
Isoelectric point according different methods:
Peptides (in silico digests for buttom-up proteomics)
Below you can find in silico digests of the whole proteome with Trypsin, Chymotrypsin, Trypsin+LysC, LysN, ArgC proteases suitable for different mass spec machines.| Try ESI |
 |
|---|
| ChTry ESI |
 |
|---|
| ArgC ESI |
 |
|---|
| LysN ESI |
 |
|---|
| TryLysC ESI |
 |
|---|
| Try MALDI |
 |
|---|
| ChTry MALDI |
 |
|---|
| ArgC MALDI |
 |
|---|
| LysN MALDI |
 |
|---|
| TryLysC MALDI |
 |
|---|
| Try LTQ |
 |
|---|
| ChTry LTQ |
 |
|---|
| ArgC LTQ |
 |
|---|
| LysN LTQ |
 |
|---|
| TryLysC LTQ |
 |
|---|
| Try MSlow |
 |
|---|
| ChTry MSlow |
 |
|---|
| ArgC MSlow |
 |
|---|
| LysN MSlow |
 |
|---|
| TryLysC MSlow |
 |
|---|
| Try MShigh |
 |
|---|
| ChTry MShigh |
 |
|---|
| ArgC MShigh |
 |
|---|
| LysN MShigh |
 |
|---|
| TryLysC MShigh |
 |
|---|
General Statistics
Number of major isoforms |
Number of additional isoforms |
Number of all proteins |
Number of amino acids |
Min. Seq. Length |
Max. Seq. Length |
Avg. Seq. Length |
Avg. Mol. Weight |
|---|---|---|---|---|---|---|---|
0 |
1615923 |
26 |
3315 |
289.6 |
31.35 |
Amino acid frequency
Ala |
Cys |
Asp |
Glu |
Phe |
Gly |
His |
Ile |
Lys |
Leu |
|---|---|---|---|---|---|---|---|---|---|
12.881 ± 0.043 | 0.863 ± 0.011 |
5.74 ± 0.025 | 5.103 ± 0.03 |
3.712 ± 0.02 | 8.395 ± 0.028 |
2.016 ± 0.016 | 5.471 ± 0.023 |
3.481 ± 0.034 | 10.078 ± 0.044 |
Met |
Asn |
Gln |
Pro |
Arg |
Ser |
Thr |
Val |
Trp |
Tyr |
|---|---|---|---|---|---|---|---|---|---|
2.491 ± 0.015 | 2.627 ± 0.019 |
5.247 ± 0.03 | 3.283 ± 0.02 |
6.936 ± 0.036 | 5.501 ± 0.023 |
5.261 ± 0.02 | 7.416 ± 0.024 |
1.296 ± 0.013 | 2.202 ± 0.016 |
Most of the basic statistics you can see at this page can be downloaded from this CSV file
Proteome-pI is available under Creative Commons Attribution-NoDerivs license, for more details see here
| Reference: Kozlowski LP. Proteome-pI 2.0: Proteome Isoelectric Point Database Update. Nucleic Acids Res. 2021, doi: 10.1093/nar/gkab944 | Contact: Lukasz P. Kozlowski |
