Longibaculum muris
Taxonomy: cellular organisms; Bacteria; Terrabacteria group; Firmicutes; Erysipelotrichia; Erysipelotrichales; Erysipelotrichaceae; Longibaculum
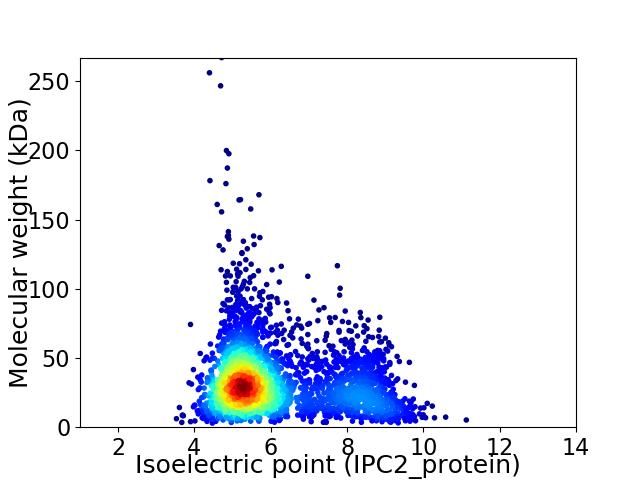
Average proteome isoelectric point is 6.09
Get precalculated fractions of proteins

Virtual 2D-PAGE plot for 3164 proteins (isoelectric point calculated using IPC2_protein)
Get csv file with sequences according to given criteria:
* You can choose from 21 different methods for calculating isoelectric point
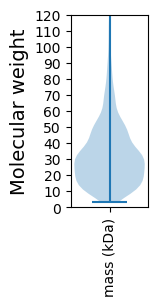
Summary statistics related to proteome-wise predictions


Protein with the lowest isoelectric point:
>tr|A0A4R3Z5Q2|A0A4R3Z5Q2_9FIRM 50S ribosomal protein L11 OS=Longibaculum muris OX=1796628 GN=rplK PE=3 SV=1
MM1 pKa = 7.71LLEE4 pKa = 5.51HH5 pKa = 7.24ILDD8 pKa = 4.34CVNDD12 pKa = 3.41IYY14 pKa = 11.25EE15 pKa = 4.56DD16 pKa = 3.84VMEE19 pKa = 4.69GASPEE24 pKa = 4.05LMNVLKK30 pKa = 10.52QLEE33 pKa = 4.4EE34 pKa = 4.04EE35 pKa = 4.27AHH37 pKa = 6.67DD38 pKa = 4.43SSVDD42 pKa = 3.74LTKK45 pKa = 10.73KK46 pKa = 10.69AIMLSMTLCMSQLEE60 pKa = 4.16FDD62 pKa = 4.78DD63 pKa = 5.93DD64 pKa = 4.25LFEE67 pKa = 5.74GLLLEE72 pKa = 4.69NLDD75 pKa = 4.26HH76 pKa = 6.44FVKK79 pKa = 10.56HH80 pKa = 6.01IPDD83 pKa = 3.46MKK85 pKa = 10.0KK86 pKa = 8.89TMSLRR91 pKa = 11.84IEE93 pKa = 3.93LRR95 pKa = 11.84GLEE98 pKa = 4.19KK99 pKa = 10.76NVNRR103 pKa = 11.84VIKK106 pKa = 10.33VPYY109 pKa = 10.57GMVLADD115 pKa = 4.25LAYY118 pKa = 10.91LILASMNAEE127 pKa = 4.04GEE129 pKa = 4.23HH130 pKa = 6.66LFTFISDD137 pKa = 3.49EE138 pKa = 4.16GKK140 pKa = 10.77YY141 pKa = 10.93GCDD144 pKa = 3.09QCDD147 pKa = 3.25GEE149 pKa = 4.88MIDD152 pKa = 5.81GYY154 pKa = 11.02AADD157 pKa = 3.99MTIADD162 pKa = 4.54LSLHH166 pKa = 6.18EE167 pKa = 4.98GSHH170 pKa = 5.93LVLWYY175 pKa = 10.37DD176 pKa = 3.88FGDD179 pKa = 4.02DD180 pKa = 3.92YY181 pKa = 11.68FFDD184 pKa = 3.44IHH186 pKa = 8.29VMDD189 pKa = 3.98VDD191 pKa = 3.73EE192 pKa = 5.66HH193 pKa = 8.52NDD195 pKa = 3.3IQSLDD200 pKa = 3.9DD201 pKa = 4.19LKK203 pKa = 11.47VLAGEE208 pKa = 5.37GYY210 pKa = 10.46GIWEE214 pKa = 5.07DD215 pKa = 3.46EE216 pKa = 4.24HH217 pKa = 8.13QLLEE221 pKa = 4.55LYY223 pKa = 10.46YY224 pKa = 10.05EE225 pKa = 4.25NQEE228 pKa = 3.62EE229 pKa = 4.37FLRR232 pKa = 11.84VVSEE236 pKa = 3.97MGLNEE241 pKa = 5.08DD242 pKa = 5.26DD243 pKa = 6.5FILEE247 pKa = 4.73DD248 pKa = 5.03FDD250 pKa = 5.74VDD252 pKa = 4.27DD253 pKa = 5.29ANEE256 pKa = 3.97FLLDD260 pKa = 3.41NYY262 pKa = 10.6EE263 pKa = 4.13FLKK266 pKa = 10.3TSYY269 pKa = 10.11EE270 pKa = 4.23VYY272 pKa = 10.83DD273 pKa = 3.88EE274 pKa = 5.0DD275 pKa = 5.3VYY277 pKa = 11.94
MM1 pKa = 7.71LLEE4 pKa = 5.51HH5 pKa = 7.24ILDD8 pKa = 4.34CVNDD12 pKa = 3.41IYY14 pKa = 11.25EE15 pKa = 4.56DD16 pKa = 3.84VMEE19 pKa = 4.69GASPEE24 pKa = 4.05LMNVLKK30 pKa = 10.52QLEE33 pKa = 4.4EE34 pKa = 4.04EE35 pKa = 4.27AHH37 pKa = 6.67DD38 pKa = 4.43SSVDD42 pKa = 3.74LTKK45 pKa = 10.73KK46 pKa = 10.69AIMLSMTLCMSQLEE60 pKa = 4.16FDD62 pKa = 4.78DD63 pKa = 5.93DD64 pKa = 4.25LFEE67 pKa = 5.74GLLLEE72 pKa = 4.69NLDD75 pKa = 4.26HH76 pKa = 6.44FVKK79 pKa = 10.56HH80 pKa = 6.01IPDD83 pKa = 3.46MKK85 pKa = 10.0KK86 pKa = 8.89TMSLRR91 pKa = 11.84IEE93 pKa = 3.93LRR95 pKa = 11.84GLEE98 pKa = 4.19KK99 pKa = 10.76NVNRR103 pKa = 11.84VIKK106 pKa = 10.33VPYY109 pKa = 10.57GMVLADD115 pKa = 4.25LAYY118 pKa = 10.91LILASMNAEE127 pKa = 4.04GEE129 pKa = 4.23HH130 pKa = 6.66LFTFISDD137 pKa = 3.49EE138 pKa = 4.16GKK140 pKa = 10.77YY141 pKa = 10.93GCDD144 pKa = 3.09QCDD147 pKa = 3.25GEE149 pKa = 4.88MIDD152 pKa = 5.81GYY154 pKa = 11.02AADD157 pKa = 3.99MTIADD162 pKa = 4.54LSLHH166 pKa = 6.18EE167 pKa = 4.98GSHH170 pKa = 5.93LVLWYY175 pKa = 10.37DD176 pKa = 3.88FGDD179 pKa = 4.02DD180 pKa = 3.92YY181 pKa = 11.68FFDD184 pKa = 3.44IHH186 pKa = 8.29VMDD189 pKa = 3.98VDD191 pKa = 3.73EE192 pKa = 5.66HH193 pKa = 8.52NDD195 pKa = 3.3IQSLDD200 pKa = 3.9DD201 pKa = 4.19LKK203 pKa = 11.47VLAGEE208 pKa = 5.37GYY210 pKa = 10.46GIWEE214 pKa = 5.07DD215 pKa = 3.46EE216 pKa = 4.24HH217 pKa = 8.13QLLEE221 pKa = 4.55LYY223 pKa = 10.46YY224 pKa = 10.05EE225 pKa = 4.25NQEE228 pKa = 3.62EE229 pKa = 4.37FLRR232 pKa = 11.84VVSEE236 pKa = 3.97MGLNEE241 pKa = 5.08DD242 pKa = 5.26DD243 pKa = 6.5FILEE247 pKa = 4.73DD248 pKa = 5.03FDD250 pKa = 5.74VDD252 pKa = 4.27DD253 pKa = 5.29ANEE256 pKa = 3.97FLLDD260 pKa = 3.41NYY262 pKa = 10.6EE263 pKa = 4.13FLKK266 pKa = 10.3TSYY269 pKa = 10.11EE270 pKa = 4.23VYY272 pKa = 10.83DD273 pKa = 3.88EE274 pKa = 5.0DD275 pKa = 5.3VYY277 pKa = 11.94
Molecular weight: 32.06 kDa
Isoelectric point according different methods:
Protein with the highest isoelectric point:
>tr|A0A4R3YR90|A0A4R3YR90_9FIRM Pyridoxal phosphate homeostasis protein OS=Longibaculum muris OX=1796628 GN=EDD60_11717 PE=3 SV=1
MM1 pKa = 7.35KK2 pKa = 9.42RR3 pKa = 11.84TYY5 pKa = 10.34QPNKK9 pKa = 8.51RR10 pKa = 11.84KK11 pKa = 9.77RR12 pKa = 11.84SKK14 pKa = 8.62THH16 pKa = 5.5GFRR19 pKa = 11.84ARR21 pKa = 11.84MATVGGRR28 pKa = 11.84KK29 pKa = 9.08VLARR33 pKa = 11.84RR34 pKa = 11.84RR35 pKa = 11.84KK36 pKa = 9.02RR37 pKa = 11.84GRR39 pKa = 11.84KK40 pKa = 8.93VLSAA44 pKa = 4.11
MM1 pKa = 7.35KK2 pKa = 9.42RR3 pKa = 11.84TYY5 pKa = 10.34QPNKK9 pKa = 8.51RR10 pKa = 11.84KK11 pKa = 9.77RR12 pKa = 11.84SKK14 pKa = 8.62THH16 pKa = 5.5GFRR19 pKa = 11.84ARR21 pKa = 11.84MATVGGRR28 pKa = 11.84KK29 pKa = 9.08VLARR33 pKa = 11.84RR34 pKa = 11.84RR35 pKa = 11.84KK36 pKa = 9.02RR37 pKa = 11.84GRR39 pKa = 11.84KK40 pKa = 8.93VLSAA44 pKa = 4.11
Molecular weight: 5.2 kDa
Isoelectric point according different methods:
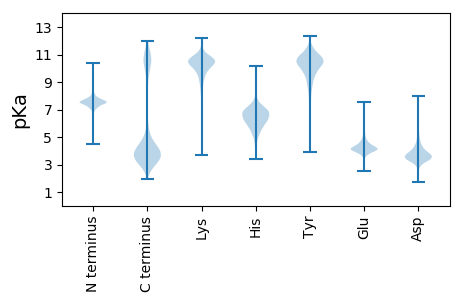
Peptides (in silico digests for buttom-up proteomics)
Below you can find in silico digests of the whole proteome with Trypsin, Chymotrypsin, Trypsin+LysC, LysN, ArgC proteases suitable for different mass spec machines.| Try ESI |
 |
|---|
| ChTry ESI |
 |
|---|
| ArgC ESI |
 |
|---|
| LysN ESI |
 |
|---|
| TryLysC ESI |
 |
|---|
| Try MALDI |
 |
|---|
| ChTry MALDI |
 |
|---|
| ArgC MALDI |
 |
|---|
| LysN MALDI |
 |
|---|
| TryLysC MALDI |
 |
|---|
| Try LTQ |
 |
|---|
| ChTry LTQ |
 |
|---|
| ArgC LTQ |
 |
|---|
| LysN LTQ |
 |
|---|
| TryLysC LTQ |
 |
|---|
| Try MSlow |
 |
|---|
| ChTry MSlow |
 |
|---|
| ArgC MSlow |
 |
|---|
| LysN MSlow |
 |
|---|
| TryLysC MSlow |
 |
|---|
| Try MShigh |
 |
|---|
| ChTry MShigh |
 |
|---|
| ArgC MShigh |
 |
|---|
| LysN MShigh |
 |
|---|
| TryLysC MShigh |
 |
|---|
General Statistics
Number of major isoforms |
Number of additional isoforms |
Number of all proteins |
Number of amino acids |
Min. Seq. Length |
Max. Seq. Length |
Avg. Seq. Length |
Avg. Mol. Weight |
|---|---|---|---|---|---|---|---|
0 |
953661 |
27 |
2519 |
301.4 |
34.34 |
Amino acid frequency
Ala |
Cys |
Asp |
Glu |
Phe |
Gly |
His |
Ile |
Lys |
Leu |
|---|---|---|---|---|---|---|---|---|---|
5.702 ± 0.049 | 1.426 ± 0.015 |
5.978 ± 0.035 | 6.846 ± 0.051 |
4.486 ± 0.04 | 5.947 ± 0.051 |
2.338 ± 0.025 | 8.868 ± 0.054 |
7.694 ± 0.039 | 9.517 ± 0.047 |
Met |
Asn |
Gln |
Pro |
Arg |
Ser |
Thr |
Val |
Trp |
Tyr |
|---|---|---|---|---|---|---|---|---|---|
3.065 ± 0.025 | 4.987 ± 0.037 |
2.869 ± 0.023 | 4.097 ± 0.035 |
3.253 ± 0.029 | 5.833 ± 0.038 |
4.989 ± 0.041 | 6.434 ± 0.036 |
0.736 ± 0.015 | 4.934 ± 0.04 |
Most of the basic statistics you can see at this page can be downloaded from this CSV file
Proteome-pI is available under Creative Commons Attribution-NoDerivs license, for more details see here
| Reference: Kozlowski LP. Proteome-pI 2.0: Proteome Isoelectric Point Database Update. Nucleic Acids Res. 2021, doi: 10.1093/nar/gkab944 | Contact: Lukasz P. Kozlowski |
