Wolbachia endosymbiont of Onchocerca ochengi
Taxonomy: cellular organisms; Bacteria; Proteobacteria; Alphaproteobacteria; Rickettsiales; Anaplasmataceae; Wolbachieae; Wolbachia; unclassified Wolbachia
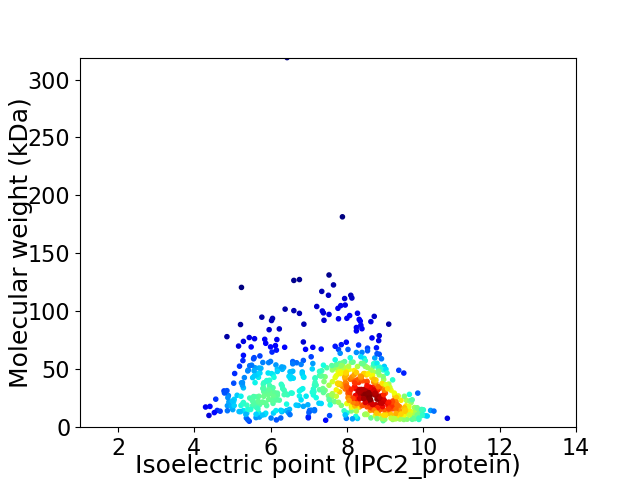
Average proteome isoelectric point is 7.52
Get precalculated fractions of proteins

Virtual 2D-PAGE plot for 647 proteins (isoelectric point calculated using IPC2_protein)
Get csv file with sequences according to given criteria:
* You can choose from 21 different methods for calculating isoelectric point
Summary statistics related to proteome-wise predictions


Protein with the lowest isoelectric point:
>tr|I7JF30|I7JF30_9RICK Cytochrome aa3 subunit 3 OS=Wolbachia endosymbiont of Onchocerca ochengi OX=100901 GN=wOo_08890 PE=3 SV=1
MM1 pKa = 7.52SSEE4 pKa = 4.08VQGPNIAEE12 pKa = 3.93WQAQQQHH19 pKa = 5.25QEE21 pKa = 4.12YY22 pKa = 10.03QGGKK26 pKa = 8.98SGFGLGHH33 pKa = 6.56SDD35 pKa = 3.35SVATIVDD42 pKa = 3.45GMKK45 pKa = 9.62WLFSFHH51 pKa = 6.65EE52 pKa = 4.56GAITSYY58 pKa = 11.36NNVFEE63 pKa = 4.35GLISGSSLVTLFGKK77 pKa = 9.67SGNMFDD83 pKa = 3.99IKK85 pKa = 10.59FLEE88 pKa = 4.44GLAEE92 pKa = 4.19HH93 pKa = 6.85FSGGGGDD100 pKa = 3.97GEE102 pKa = 5.18GITLEE107 pKa = 4.21EE108 pKa = 3.89TDD110 pKa = 3.43MGYY113 pKa = 10.91SNKK116 pKa = 9.72GSHH119 pKa = 7.01LDD121 pKa = 3.73DD122 pKa = 4.26YY123 pKa = 11.37SNSSSEE129 pKa = 4.16IAHH132 pKa = 6.28SADD135 pKa = 3.31GLHH138 pKa = 6.98GIHH141 pKa = 6.87NSGDD145 pKa = 3.45YY146 pKa = 10.07HH147 pKa = 7.04DD148 pKa = 5.79CSFSPSPSPSVGDD161 pKa = 3.38DD162 pKa = 2.95HH163 pKa = 9.09GYY165 pKa = 10.04EE166 pKa = 4.06LSVV169 pKa = 3.28
MM1 pKa = 7.52SSEE4 pKa = 4.08VQGPNIAEE12 pKa = 3.93WQAQQQHH19 pKa = 5.25QEE21 pKa = 4.12YY22 pKa = 10.03QGGKK26 pKa = 8.98SGFGLGHH33 pKa = 6.56SDD35 pKa = 3.35SVATIVDD42 pKa = 3.45GMKK45 pKa = 9.62WLFSFHH51 pKa = 6.65EE52 pKa = 4.56GAITSYY58 pKa = 11.36NNVFEE63 pKa = 4.35GLISGSSLVTLFGKK77 pKa = 9.67SGNMFDD83 pKa = 3.99IKK85 pKa = 10.59FLEE88 pKa = 4.44GLAEE92 pKa = 4.19HH93 pKa = 6.85FSGGGGDD100 pKa = 3.97GEE102 pKa = 5.18GITLEE107 pKa = 4.21EE108 pKa = 3.89TDD110 pKa = 3.43MGYY113 pKa = 10.91SNKK116 pKa = 9.72GSHH119 pKa = 7.01LDD121 pKa = 3.73DD122 pKa = 4.26YY123 pKa = 11.37SNSSSEE129 pKa = 4.16IAHH132 pKa = 6.28SADD135 pKa = 3.31GLHH138 pKa = 6.98GIHH141 pKa = 6.87NSGDD145 pKa = 3.45YY146 pKa = 10.07HH147 pKa = 7.04DD148 pKa = 5.79CSFSPSPSPSVGDD161 pKa = 3.38DD162 pKa = 2.95HH163 pKa = 9.09GYY165 pKa = 10.04EE166 pKa = 4.06LSVV169 pKa = 3.28
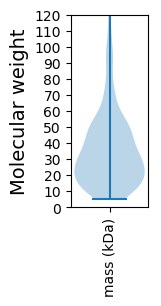
Molecular weight: 17.94 kDa
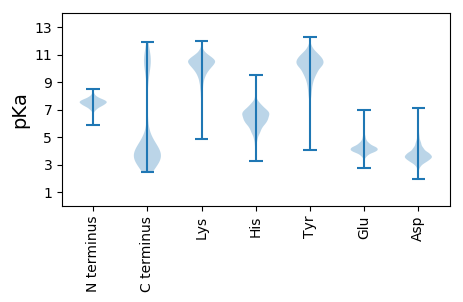
Isoelectric point according different methods:
Protein with the highest isoelectric point:
>tr|I7IAI5|I7IAI5_9RICK Lipoprotein OsmY ortholog OS=Wolbachia endosymbiont of Onchocerca ochengi OX=100901 GN=wOo_09480 PE=4 SV=1
MM1 pKa = 6.87VKK3 pKa = 10.08KK4 pKa = 10.45RR5 pKa = 11.84NSFNDD10 pKa = 3.1SYY12 pKa = 11.93LSMNNRR18 pKa = 11.84TGFRR22 pKa = 11.84RR23 pKa = 11.84SKK25 pKa = 10.4ACPLATSKK33 pKa = 11.5DD34 pKa = 3.19EE35 pKa = 5.55DD36 pKa = 3.36IDD38 pKa = 4.03YY39 pKa = 11.23KK40 pKa = 10.87NTDD43 pKa = 4.11LLSKK47 pKa = 9.3FTSDD51 pKa = 3.32YY52 pKa = 11.28GRR54 pKa = 11.84ILPRR58 pKa = 11.84RR59 pKa = 11.84LTGVCARR66 pKa = 11.84RR67 pKa = 11.84QRR69 pKa = 11.84KK70 pKa = 8.36LRR72 pKa = 11.84LAIIRR77 pKa = 11.84ARR79 pKa = 11.84FLALVPYY86 pKa = 7.91CTKK89 pKa = 10.62KK90 pKa = 10.81AA91 pKa = 3.45
MM1 pKa = 6.87VKK3 pKa = 10.08KK4 pKa = 10.45RR5 pKa = 11.84NSFNDD10 pKa = 3.1SYY12 pKa = 11.93LSMNNRR18 pKa = 11.84TGFRR22 pKa = 11.84RR23 pKa = 11.84SKK25 pKa = 10.4ACPLATSKK33 pKa = 11.5DD34 pKa = 3.19EE35 pKa = 5.55DD36 pKa = 3.36IDD38 pKa = 4.03YY39 pKa = 11.23KK40 pKa = 10.87NTDD43 pKa = 4.11LLSKK47 pKa = 9.3FTSDD51 pKa = 3.32YY52 pKa = 11.28GRR54 pKa = 11.84ILPRR58 pKa = 11.84RR59 pKa = 11.84LTGVCARR66 pKa = 11.84RR67 pKa = 11.84QRR69 pKa = 11.84KK70 pKa = 8.36LRR72 pKa = 11.84LAIIRR77 pKa = 11.84ARR79 pKa = 11.84FLALVPYY86 pKa = 7.91CTKK89 pKa = 10.62KK90 pKa = 10.81AA91 pKa = 3.45
Molecular weight: 10.59 kDa
Isoelectric point according different methods:
Peptides (in silico digests for buttom-up proteomics)
Below you can find in silico digests of the whole proteome with Trypsin, Chymotrypsin, Trypsin+LysC, LysN, ArgC proteases suitable for different mass spec machines.| Try ESI |
 |
|---|
| ChTry ESI |
 |
|---|
| ArgC ESI |
 |
|---|
| LysN ESI |
 |
|---|
| TryLysC ESI |
 |
|---|
| Try MALDI |
 |
|---|
| ChTry MALDI |
 |
|---|
| ArgC MALDI |
 |
|---|
| LysN MALDI |
 |
|---|
| TryLysC MALDI |
 |
|---|
| Try LTQ |
 |
|---|
| ChTry LTQ |
 |
|---|
| ArgC LTQ |
 |
|---|
| LysN LTQ |
 |
|---|
| TryLysC LTQ |
 |
|---|
| Try MSlow |
 |
|---|
| ChTry MSlow |
 |
|---|
| ArgC MSlow |
 |
|---|
| LysN MSlow |
 |
|---|
| TryLysC MSlow |
 |
|---|
| Try MShigh |
 |
|---|
| ChTry MShigh |
 |
|---|
| ArgC MShigh |
 |
|---|
| LysN MShigh |
 |
|---|
| TryLysC MShigh |
 |
|---|
General Statistics
Number of major isoforms |
Number of additional isoforms |
Number of all proteins |
Number of amino acids |
Min. Seq. Length |
Max. Seq. Length |
Avg. Seq. Length |
Avg. Mol. Weight |
|---|---|---|---|---|---|---|---|
0 |
211834 |
45 |
2840 |
327.4 |
36.91 |
Amino acid frequency
Ala |
Cys |
Asp |
Glu |
Phe |
Gly |
His |
Ile |
Lys |
Leu |
|---|---|---|---|---|---|---|---|---|---|
5.757 ± 0.075 | 1.386 ± 0.036 |
4.838 ± 0.063 | 6.172 ± 0.097 |
4.653 ± 0.072 | 5.921 ± 0.072 |
1.879 ± 0.032 | 9.667 ± 0.086 |
8.413 ± 0.085 | 9.757 ± 0.093 |
Met |
Asn |
Gln |
Pro |
Arg |
Ser |
Thr |
Val |
Trp |
Tyr |
|---|---|---|---|---|---|---|---|---|---|
2.243 ± 0.035 | 5.927 ± 0.067 |
3.053 ± 0.043 | 2.907 ± 0.042 |
4.07 ± 0.061 | 7.622 ± 0.067 |
4.661 ± 0.049 | 6.689 ± 0.066 |
0.779 ± 0.029 | 3.605 ± 0.052 |
Most of the basic statistics you can see at this page can be downloaded from this CSV file
Proteome-pI is available under Creative Commons Attribution-NoDerivs license, for more details see here
| Reference: Kozlowski LP. Proteome-pI 2.0: Proteome Isoelectric Point Database Update. Nucleic Acids Res. 2021, doi: 10.1093/nar/gkab944 | Contact: Lukasz P. Kozlowski |
