Ornithinicoccus hortensis
Taxonomy: cellular organisms; Bacteria; Terrabacteria group; Actinobacteria;
Average proteome isoelectric point is 5.9
Get precalculated fractions of proteins

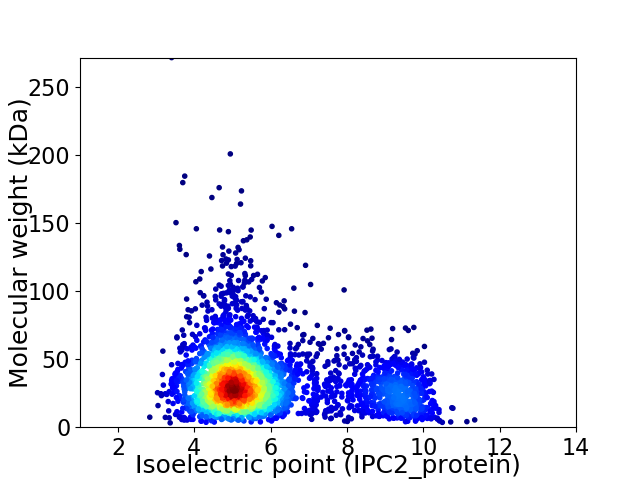
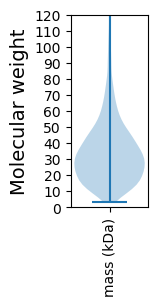
Virtual 2D-PAGE plot for 3571 proteins (isoelectric point calculated using IPC2_protein)
Get csv file with sequences according to given criteria:
* You can choose from 21 different methods for calculating isoelectric point
Summary statistics related to proteome-wise predictions


Protein with the lowest isoelectric point:
>tr|A0A542YLS3|A0A542YLS3_9MICO Amino acid/amide ABC transporter ATP-binding protein 1 (HAAT family) OS=Ornithinicoccus hortensis OX=82346 GN=FB467_0093 PE=4 SV=1
MM1 pKa = 7.62SSTAHH6 pKa = 6.73HH7 pKa = 6.8DD8 pKa = 3.36QPTFEE13 pKa = 4.52GRR15 pKa = 11.84PLARR19 pKa = 11.84PEE21 pKa = 5.5DD22 pKa = 4.05DD23 pKa = 6.52LEE25 pKa = 4.48DD26 pKa = 3.48QGAGFDD32 pKa = 3.51AATLVTRR39 pKa = 11.84RR40 pKa = 11.84RR41 pKa = 11.84VLSVVGVGVGAAALAACGTDD61 pKa = 2.96ATTSTSSSSSTSSADD76 pKa = 3.28NGSATSGGASADD88 pKa = 3.71SGTATSDD95 pKa = 2.75GSTAAGTLEE104 pKa = 4.72EE105 pKa = 4.96IPEE108 pKa = 4.35EE109 pKa = 4.33TNGPYY114 pKa = 9.97PADD117 pKa = 3.5GTQDD121 pKa = 3.47VNVLTEE127 pKa = 4.09SGIVRR132 pKa = 11.84QDD134 pKa = 2.53ITTSLDD140 pKa = 3.19GGSSVDD146 pKa = 4.06GVALTMTFLVHH157 pKa = 7.6DD158 pKa = 4.56MVNDD162 pKa = 3.58QPFEE166 pKa = 4.15GVAVYY171 pKa = 9.59AWQCDD176 pKa = 3.4AEE178 pKa = 4.73GRR180 pKa = 11.84YY181 pKa = 10.61SMYY184 pKa = 9.51TQGVEE189 pKa = 4.01DD190 pKa = 4.15EE191 pKa = 4.2TWLRR195 pKa = 11.84GIQVADD201 pKa = 3.43SDD203 pKa = 4.34GMVSFSTIVPGCYY216 pKa = 9.3SGRR219 pKa = 11.84WPHH222 pKa = 6.02IHH224 pKa = 6.47FEE226 pKa = 4.28VYY228 pKa = 10.33PDD230 pKa = 3.28VDD232 pKa = 3.57SATDD236 pKa = 3.38VGNVIATSQVAFPEE250 pKa = 5.17DD251 pKa = 3.95ILTEE255 pKa = 3.96IYY257 pKa = 9.73TRR259 pKa = 11.84SEE261 pKa = 4.23YY262 pKa = 10.97AGSAEE267 pKa = 3.75NMAAVGSVEE276 pKa = 3.65QDD278 pKa = 3.25MIFADD283 pKa = 4.59SLDD286 pKa = 3.57QQMPTISGDD295 pKa = 3.11VDD297 pKa = 3.32SGYY300 pKa = 10.44IATLTVNVDD309 pKa = 3.4TTTEE313 pKa = 3.73ATGAGGGPGGGAGGPGGGGQPPSGGGPGGEE343 pKa = 4.32PPSGEE348 pKa = 4.11PPTNN352 pKa = 3.36
MM1 pKa = 7.62SSTAHH6 pKa = 6.73HH7 pKa = 6.8DD8 pKa = 3.36QPTFEE13 pKa = 4.52GRR15 pKa = 11.84PLARR19 pKa = 11.84PEE21 pKa = 5.5DD22 pKa = 4.05DD23 pKa = 6.52LEE25 pKa = 4.48DD26 pKa = 3.48QGAGFDD32 pKa = 3.51AATLVTRR39 pKa = 11.84RR40 pKa = 11.84RR41 pKa = 11.84VLSVVGVGVGAAALAACGTDD61 pKa = 2.96ATTSTSSSSSTSSADD76 pKa = 3.28NGSATSGGASADD88 pKa = 3.71SGTATSDD95 pKa = 2.75GSTAAGTLEE104 pKa = 4.72EE105 pKa = 4.96IPEE108 pKa = 4.35EE109 pKa = 4.33TNGPYY114 pKa = 9.97PADD117 pKa = 3.5GTQDD121 pKa = 3.47VNVLTEE127 pKa = 4.09SGIVRR132 pKa = 11.84QDD134 pKa = 2.53ITTSLDD140 pKa = 3.19GGSSVDD146 pKa = 4.06GVALTMTFLVHH157 pKa = 7.6DD158 pKa = 4.56MVNDD162 pKa = 3.58QPFEE166 pKa = 4.15GVAVYY171 pKa = 9.59AWQCDD176 pKa = 3.4AEE178 pKa = 4.73GRR180 pKa = 11.84YY181 pKa = 10.61SMYY184 pKa = 9.51TQGVEE189 pKa = 4.01DD190 pKa = 4.15EE191 pKa = 4.2TWLRR195 pKa = 11.84GIQVADD201 pKa = 3.43SDD203 pKa = 4.34GMVSFSTIVPGCYY216 pKa = 9.3SGRR219 pKa = 11.84WPHH222 pKa = 6.02IHH224 pKa = 6.47FEE226 pKa = 4.28VYY228 pKa = 10.33PDD230 pKa = 3.28VDD232 pKa = 3.57SATDD236 pKa = 3.38VGNVIATSQVAFPEE250 pKa = 5.17DD251 pKa = 3.95ILTEE255 pKa = 3.96IYY257 pKa = 9.73TRR259 pKa = 11.84SEE261 pKa = 4.23YY262 pKa = 10.97AGSAEE267 pKa = 3.75NMAAVGSVEE276 pKa = 3.65QDD278 pKa = 3.25MIFADD283 pKa = 4.59SLDD286 pKa = 3.57QQMPTISGDD295 pKa = 3.11VDD297 pKa = 3.32SGYY300 pKa = 10.44IATLTVNVDD309 pKa = 3.4TTTEE313 pKa = 3.73ATGAGGGPGGGAGGPGGGGQPPSGGGPGGEE343 pKa = 4.32PPSGEE348 pKa = 4.11PPTNN352 pKa = 3.36
Molecular weight: 35.61 kDa
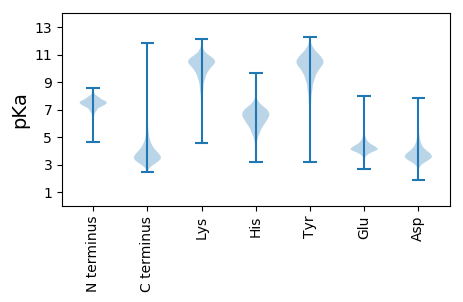
Isoelectric point according different methods:
Protein with the highest isoelectric point:
>tr|A0A542YNC8|A0A542YNC8_9MICO L-aminopeptidase/D-esterase-like protein OS=Ornithinicoccus hortensis OX=82346 GN=FB467_0690 PE=3 SV=1
MM1 pKa = 7.69SKK3 pKa = 9.0RR4 pKa = 11.84TFQPNNRR11 pKa = 11.84RR12 pKa = 11.84RR13 pKa = 11.84ARR15 pKa = 11.84VHH17 pKa = 5.99GFRR20 pKa = 11.84LRR22 pKa = 11.84MRR24 pKa = 11.84TRR26 pKa = 11.84AGRR29 pKa = 11.84SILANRR35 pKa = 11.84RR36 pKa = 11.84RR37 pKa = 11.84KK38 pKa = 9.8GRR40 pKa = 11.84SSLSAA45 pKa = 3.62
MM1 pKa = 7.69SKK3 pKa = 9.0RR4 pKa = 11.84TFQPNNRR11 pKa = 11.84RR12 pKa = 11.84RR13 pKa = 11.84ARR15 pKa = 11.84VHH17 pKa = 5.99GFRR20 pKa = 11.84LRR22 pKa = 11.84MRR24 pKa = 11.84TRR26 pKa = 11.84AGRR29 pKa = 11.84SILANRR35 pKa = 11.84RR36 pKa = 11.84RR37 pKa = 11.84KK38 pKa = 9.8GRR40 pKa = 11.84SSLSAA45 pKa = 3.62
Molecular weight: 5.37 kDa
Isoelectric point according different methods:
Peptides (in silico digests for buttom-up proteomics)
Below you can find in silico digests of the whole proteome with Trypsin, Chymotrypsin, Trypsin+LysC, LysN, ArgC proteases suitable for different mass spec machines.| Try ESI |
 |
|---|
| ChTry ESI |
 |
|---|
| ArgC ESI |
 |
|---|
| LysN ESI |
 |
|---|
| TryLysC ESI |
 |
|---|
| Try MALDI |
 |
|---|
| ChTry MALDI |
 |
|---|
| ArgC MALDI |
 |
|---|
| LysN MALDI |
 |
|---|
| TryLysC MALDI |
 |
|---|
| Try LTQ |
 |
|---|
| ChTry LTQ |
 |
|---|
| ArgC LTQ |
 |
|---|
| LysN LTQ |
 |
|---|
| TryLysC LTQ |
 |
|---|
| Try MSlow |
 |
|---|
| ChTry MSlow |
 |
|---|
| ArgC MSlow |
 |
|---|
| LysN MSlow |
 |
|---|
| TryLysC MSlow |
 |
|---|
| Try MShigh |
 |
|---|
| ChTry MShigh |
 |
|---|
| ArgC MShigh |
 |
|---|
| LysN MShigh |
 |
|---|
| TryLysC MShigh |
 |
|---|
General Statistics
Number of major isoforms |
Number of additional isoforms |
Number of all proteins |
Number of amino acids |
Min. Seq. Length |
Max. Seq. Length |
Avg. Seq. Length |
Avg. Mol. Weight |
|---|---|---|---|---|---|---|---|
0 |
1191262 |
29 |
2581 |
333.6 |
35.66 |
Amino acid frequency
Ala |
Cys |
Asp |
Glu |
Phe |
Gly |
His |
Ile |
Lys |
Leu |
|---|---|---|---|---|---|---|---|---|---|
12.878 ± 0.052 | 0.663 ± 0.012 |
6.402 ± 0.034 | 6.107 ± 0.043 |
2.68 ± 0.025 | 9.669 ± 0.035 |
2.184 ± 0.022 | 3.374 ± 0.029 |
1.575 ± 0.028 | 10.421 ± 0.054 |
Met |
Asn |
Gln |
Pro |
Arg |
Ser |
Thr |
Val |
Trp |
Tyr |
|---|---|---|---|---|---|---|---|---|---|
1.835 ± 0.018 | 1.623 ± 0.021 |
5.863 ± 0.031 | 3.041 ± 0.025 |
7.563 ± 0.046 | 5.053 ± 0.025 |
6.236 ± 0.035 | 9.351 ± 0.037 |
1.559 ± 0.019 | 1.924 ± 0.019 |
Most of the basic statistics you can see at this page can be downloaded from this CSV file
Proteome-pI is available under Creative Commons Attribution-NoDerivs license, for more details see here
| Reference: Kozlowski LP. Proteome-pI 2.0: Proteome Isoelectric Point Database Update. Nucleic Acids Res. 2021, doi: 10.1093/nar/gkab944 | Contact: Lukasz P. Kozlowski |
