Microbacterium phage Appa
Taxonomy: Viruses; Duplodnaviria; Heunggongvirae; Uroviricota; Caudoviricetes; Caudovirales; Siphoviridae; Appavirus; Microbacterium virus Appa
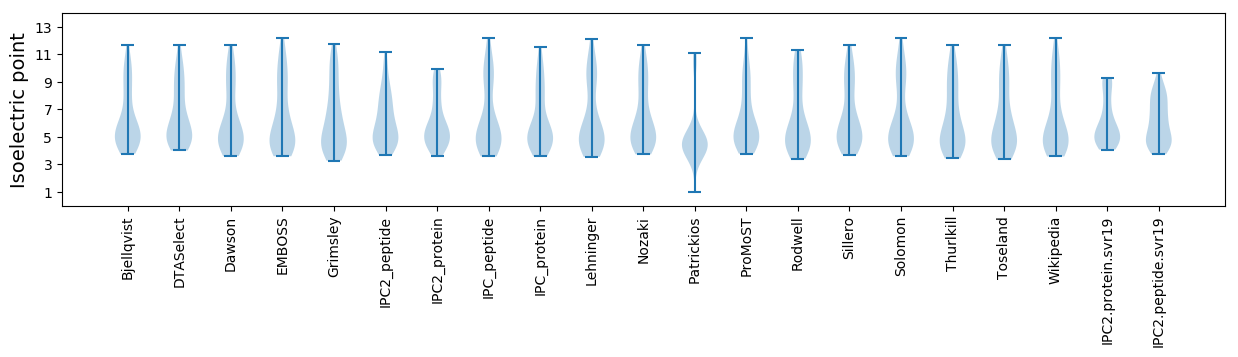
Average proteome isoelectric point is 6.12
Get precalculated fractions of proteins

Virtual 2D-PAGE plot for 65 proteins (isoelectric point calculated using IPC2_protein)
Get csv file with sequences according to given criteria:
* You can choose from 21 different methods for calculating isoelectric point
Summary statistics related to proteome-wise predictions
Protein with the lowest isoelectric point:
>tr|A0A2U8UHT7|A0A2U8UHT7_9CAUD Uncharacterized protein OS=Microbacterium phage Appa OX=2182350 GN=11 PE=4 SV=1
MM1 pKa = 7.18TKK3 pKa = 10.04RR4 pKa = 11.84RR5 pKa = 11.84STIMTEE11 pKa = 3.82QTVNPLPAFNIDD23 pKa = 3.96DD24 pKa = 3.82VDD26 pKa = 4.51DD27 pKa = 4.96GEE29 pKa = 4.94RR30 pKa = 11.84NWAALALCVLDD41 pKa = 4.26IEE43 pKa = 4.64TRR45 pKa = 11.84RR46 pKa = 11.84CIYY49 pKa = 10.11CGQRR53 pKa = 11.84AVFDD57 pKa = 3.87TYY59 pKa = 11.73AEE61 pKa = 4.36YY62 pKa = 10.72VAHH65 pKa = 6.79FWAFEE70 pKa = 4.02YY71 pKa = 10.82EE72 pKa = 3.91GDD74 pKa = 3.84PWHH77 pKa = 6.96GPDD80 pKa = 5.69DD81 pKa = 4.24EE82 pKa = 6.99GDD84 pKa = 3.53FDD86 pKa = 4.49RR87 pKa = 11.84TFSLCLATADD97 pKa = 4.84DD98 pKa = 4.41VADD101 pKa = 5.09DD102 pKa = 4.52SPIAAPRR109 pKa = 11.84DD110 pKa = 3.59WNDD113 pKa = 2.85EE114 pKa = 3.69SRR116 pKa = 11.84TIVATYY122 pKa = 10.81ASTTGPGYY130 pKa = 10.87ALNVEE135 pKa = 4.83DD136 pKa = 5.16VDD138 pKa = 4.16SATYY142 pKa = 10.02RR143 pKa = 11.84PYY145 pKa = 11.14SRR147 pKa = 11.84TSAAVVRR154 pKa = 4.6
MM1 pKa = 7.18TKK3 pKa = 10.04RR4 pKa = 11.84RR5 pKa = 11.84STIMTEE11 pKa = 3.82QTVNPLPAFNIDD23 pKa = 3.96DD24 pKa = 3.82VDD26 pKa = 4.51DD27 pKa = 4.96GEE29 pKa = 4.94RR30 pKa = 11.84NWAALALCVLDD41 pKa = 4.26IEE43 pKa = 4.64TRR45 pKa = 11.84RR46 pKa = 11.84CIYY49 pKa = 10.11CGQRR53 pKa = 11.84AVFDD57 pKa = 3.87TYY59 pKa = 11.73AEE61 pKa = 4.36YY62 pKa = 10.72VAHH65 pKa = 6.79FWAFEE70 pKa = 4.02YY71 pKa = 10.82EE72 pKa = 3.91GDD74 pKa = 3.84PWHH77 pKa = 6.96GPDD80 pKa = 5.69DD81 pKa = 4.24EE82 pKa = 6.99GDD84 pKa = 3.53FDD86 pKa = 4.49RR87 pKa = 11.84TFSLCLATADD97 pKa = 4.84DD98 pKa = 4.41VADD101 pKa = 5.09DD102 pKa = 4.52SPIAAPRR109 pKa = 11.84DD110 pKa = 3.59WNDD113 pKa = 2.85EE114 pKa = 3.69SRR116 pKa = 11.84TIVATYY122 pKa = 10.81ASTTGPGYY130 pKa = 10.87ALNVEE135 pKa = 4.83DD136 pKa = 5.16VDD138 pKa = 4.16SATYY142 pKa = 10.02RR143 pKa = 11.84PYY145 pKa = 11.14SRR147 pKa = 11.84TSAAVVRR154 pKa = 4.6
Molecular weight: 17.28 kDa
Isoelectric point according different methods:
Protein with the highest isoelectric point:
>tr|A0A2U8UHW4|A0A2U8UHW4_9CAUD Fibronectin type-III domain-containing protein OS=Microbacterium phage Appa OX=2182350 GN=26 PE=4 SV=1
MM1 pKa = 6.97TVEE4 pKa = 5.56PIQVDD9 pKa = 3.89PDD11 pKa = 3.44AEE13 pKa = 4.18RR14 pKa = 11.84YY15 pKa = 5.79PTSIIICAWLLGGHH29 pKa = 6.51DD30 pKa = 3.57WRR32 pKa = 11.84LLGRR36 pKa = 11.84WDD38 pKa = 2.87WKK40 pKa = 8.15TRR42 pKa = 11.84RR43 pKa = 11.84RR44 pKa = 11.84TIDD47 pKa = 2.97RR48 pKa = 11.84EE49 pKa = 3.76RR50 pKa = 11.84CTRR53 pKa = 11.84CGVIRR58 pKa = 11.84PRR60 pKa = 11.84GGFFGARR67 pKa = 11.84RR68 pKa = 11.84RR69 pKa = 11.84DD70 pKa = 3.3LALTHH75 pKa = 6.73
MM1 pKa = 6.97TVEE4 pKa = 5.56PIQVDD9 pKa = 3.89PDD11 pKa = 3.44AEE13 pKa = 4.18RR14 pKa = 11.84YY15 pKa = 5.79PTSIIICAWLLGGHH29 pKa = 6.51DD30 pKa = 3.57WRR32 pKa = 11.84LLGRR36 pKa = 11.84WDD38 pKa = 2.87WKK40 pKa = 8.15TRR42 pKa = 11.84RR43 pKa = 11.84RR44 pKa = 11.84TIDD47 pKa = 2.97RR48 pKa = 11.84EE49 pKa = 3.76RR50 pKa = 11.84CTRR53 pKa = 11.84CGVIRR58 pKa = 11.84PRR60 pKa = 11.84GGFFGARR67 pKa = 11.84RR68 pKa = 11.84RR69 pKa = 11.84DD70 pKa = 3.3LALTHH75 pKa = 6.73
Molecular weight: 8.88 kDa
Isoelectric point according different methods:
Peptides (in silico digests for buttom-up proteomics)
Below you can find in silico digests of the whole proteome with Trypsin, Chymotrypsin, Trypsin+LysC, LysN, ArgC proteases suitable for different mass spec machines.| Try ESI |
 |
|---|
| ChTry ESI |
|
|---|
| ArgC ESI |
|
|---|
| LysN ESI |
|
|---|
| TryLysC ESI |
|
|---|
| Try MALDI |
|
|---|
| ChTry MALDI |
|
|---|
| ArgC MALDI |
|
|---|
| LysN MALDI |
|
|---|
| TryLysC MALDI |
|
|---|
| Try LTQ |
|
|---|
| ChTry LTQ |
|
|---|
| ArgC LTQ |
|
|---|
| LysN LTQ |
|
|---|
| TryLysC LTQ |
|
|---|
| Try MSlow |
|
|---|
| ChTry MSlow |
|
|---|
| ArgC MSlow |
|
|---|
| LysN MSlow |
|
|---|
| TryLysC MSlow |
|
|---|
| Try MShigh |
|
|---|
| ChTry MShigh |
|
|---|
| ArgC MShigh |
|
|---|
| LysN MShigh |
|
|---|
| TryLysC MShigh |
|
|---|
General Statistics
Number of major isoforms |
Number of additional isoforms |
Number of all proteins |
Number of amino acids |
Min. Seq. Length |
Max. Seq. Length |
Avg. Seq. Length |
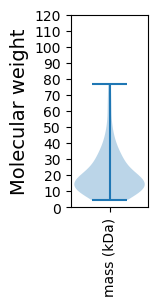
Avg. Mol. Weight |
|---|---|---|---|---|---|---|---|
0 |
12600 |
42 |
732 |
193.8 |
21.08 |
Amino acid frequency
Ala |
Cys |
Asp |
Glu |
Phe |
Gly |
His |
Ile |
Lys |
Leu |
|---|---|---|---|---|---|---|---|---|---|
12.444 ± 0.372 | 0.492 ± 0.109 |
6.921 ± 0.235 | 6.508 ± 0.276 |
2.706 ± 0.216 | 8.421 ± 0.397 |
1.786 ± 0.201 | 4.746 ± 0.238 |
3.071 ± 0.218 | 7.579 ± 0.306 |
Met |
Asn |
Gln |
Pro |
Arg |
Ser |
Thr |
Val |
Trp |
Tyr |
|---|---|---|---|---|---|---|---|---|---|
2.532 ± 0.2 | 2.429 ± 0.183 |
5.183 ± 0.363 | 3.19 ± 0.178 |
7.738 ± 0.489 | 5.69 ± 0.232 |
6.738 ± 0.29 | 7.73 ± 0.196 |
1.841 ± 0.17 | 2.254 ± 0.179 |
Most of the basic statistics you can see at this page can be downloaded from this CSV file
See this proteome in:

Proteome-pI is available under Creative Commons Attribution-NoDerivs license, for more details see here
| Reference: Kozlowski LP. Proteome-pI 2.0: Proteome Isoelectric Point Database Update. Nucleic Acids Res. 2021, doi: 10.1093/nar/gkab944 | Contact: Lukasz P. Kozlowski |