Aeropyrum pernix (strain ATCC 700893 / DSM 11879 / JCM 9820 / NBRC 100138 / K1)
Taxonomy: cellular organisms; Archaea; TACK group; Crenarchaeota; Thermoprotei; Desulfurococcales; Desulfurococcaceae; Aeropyrum; Aeropyrum pernix
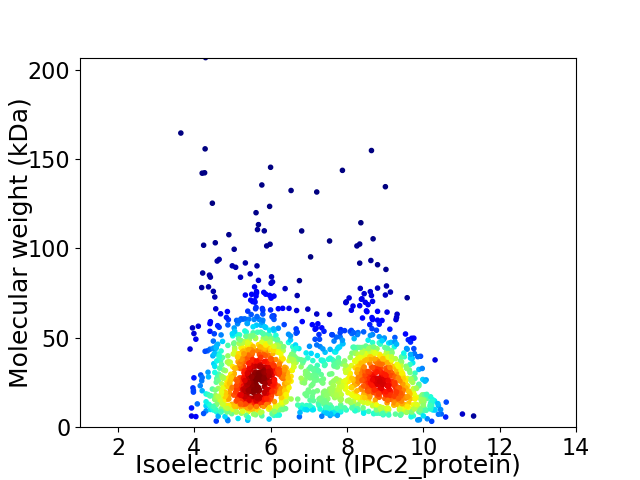
Average proteome isoelectric point is 6.96
Get precalculated fractions of proteins

Virtual 2D-PAGE plot for 1700 proteins (isoelectric point calculated using IPC2_protein)
Get csv file with sequences according to given criteria:
* You can choose from 21 different methods for calculating isoelectric point
Summary statistics related to proteome-wise predictions


Protein with the lowest isoelectric point:
>tr|Q9YEJ5|Q9YEJ5_AERPE 2-oxoacid oxidoreductase (ferredoxin) OS=Aeropyrum pernix (strain ATCC 700893 / DSM 11879 / JCM 9820 / NBRC 100138 / K1) OX=272557 GN=APE_0583 PE=4 SV=1
MM1 pKa = 7.53GVDD4 pKa = 4.05LKK6 pKa = 10.67MLAVALALSAILVGGGLYY24 pKa = 10.32AASALAHH31 pKa = 6.45GGGQGVGGMMGGSQPIASPGMGGMDD56 pKa = 3.43GHH58 pKa = 7.09DD59 pKa = 3.72EE60 pKa = 4.51PYY62 pKa = 10.55EE63 pKa = 4.3DD64 pKa = 6.02DD65 pKa = 4.17YY66 pKa = 12.15GEE68 pKa = 4.54CPMMEE73 pKa = 4.27YY74 pKa = 9.61MHH76 pKa = 6.78MGGMMGMPGPWQGGGWMQGGMGYY99 pKa = 10.61VFMDD103 pKa = 3.41QDD105 pKa = 3.79SMEE108 pKa = 4.14EE109 pKa = 3.58ALAEE113 pKa = 4.21VEE115 pKa = 4.34GVVVNALDD123 pKa = 3.85RR124 pKa = 11.84YY125 pKa = 9.25NAIVVDD131 pKa = 4.0TGDD134 pKa = 3.26GTVRR138 pKa = 11.84AKK140 pKa = 10.35ILPAYY145 pKa = 9.56IDD147 pKa = 3.58VEE149 pKa = 4.1NGYY152 pKa = 8.46MVSGAWIFEE161 pKa = 4.48NIEE164 pKa = 3.89KK165 pKa = 10.48AVEE168 pKa = 3.89DD169 pKa = 3.63RR170 pKa = 11.84GEE172 pKa = 4.17EE173 pKa = 3.94VSVRR177 pKa = 11.84LTIFRR182 pKa = 11.84GGAWTAAVAIEE193 pKa = 3.94IDD195 pKa = 3.87GVGTFVFPALYY206 pKa = 10.12DD207 pKa = 3.62ALNN210 pKa = 3.49
MM1 pKa = 7.53GVDD4 pKa = 4.05LKK6 pKa = 10.67MLAVALALSAILVGGGLYY24 pKa = 10.32AASALAHH31 pKa = 6.45GGGQGVGGMMGGSQPIASPGMGGMDD56 pKa = 3.43GHH58 pKa = 7.09DD59 pKa = 3.72EE60 pKa = 4.51PYY62 pKa = 10.55EE63 pKa = 4.3DD64 pKa = 6.02DD65 pKa = 4.17YY66 pKa = 12.15GEE68 pKa = 4.54CPMMEE73 pKa = 4.27YY74 pKa = 9.61MHH76 pKa = 6.78MGGMMGMPGPWQGGGWMQGGMGYY99 pKa = 10.61VFMDD103 pKa = 3.41QDD105 pKa = 3.79SMEE108 pKa = 4.14EE109 pKa = 3.58ALAEE113 pKa = 4.21VEE115 pKa = 4.34GVVVNALDD123 pKa = 3.85RR124 pKa = 11.84YY125 pKa = 9.25NAIVVDD131 pKa = 4.0TGDD134 pKa = 3.26GTVRR138 pKa = 11.84AKK140 pKa = 10.35ILPAYY145 pKa = 9.56IDD147 pKa = 3.58VEE149 pKa = 4.1NGYY152 pKa = 8.46MVSGAWIFEE161 pKa = 4.48NIEE164 pKa = 3.89KK165 pKa = 10.48AVEE168 pKa = 3.89DD169 pKa = 3.63RR170 pKa = 11.84GEE172 pKa = 4.17EE173 pKa = 3.94VSVRR177 pKa = 11.84LTIFRR182 pKa = 11.84GGAWTAAVAIEE193 pKa = 3.94IDD195 pKa = 3.87GVGTFVFPALYY206 pKa = 10.12DD207 pKa = 3.62ALNN210 pKa = 3.49
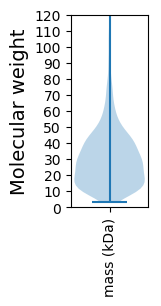
Molecular weight: 21.99 kDa
Isoelectric point according different methods:
Protein with the highest isoelectric point:
>tr|Q05DW8|Q05DW8_AERPE Uncharacterized protein OS=Aeropyrum pernix (strain ATCC 700893 / DSM 11879 / JCM 9820 / NBRC 100138 / K1) OX=272557 GN=APE_2473a PE=4 SV=1
MM1 pKa = 7.58ARR3 pKa = 11.84NKK5 pKa = 10.28PLGRR9 pKa = 11.84KK10 pKa = 8.82LRR12 pKa = 11.84LARR15 pKa = 11.84ALKK18 pKa = 10.18SNRR21 pKa = 11.84AIPVWVVIRR30 pKa = 11.84TSRR33 pKa = 11.84RR34 pKa = 11.84IRR36 pKa = 11.84FNLLRR41 pKa = 11.84RR42 pKa = 11.84HH43 pKa = 4.95WRR45 pKa = 11.84RR46 pKa = 11.84SKK48 pKa = 11.16LKK50 pKa = 9.99VV51 pKa = 3.04
MM1 pKa = 7.58ARR3 pKa = 11.84NKK5 pKa = 10.28PLGRR9 pKa = 11.84KK10 pKa = 8.82LRR12 pKa = 11.84LARR15 pKa = 11.84ALKK18 pKa = 10.18SNRR21 pKa = 11.84AIPVWVVIRR30 pKa = 11.84TSRR33 pKa = 11.84RR34 pKa = 11.84IRR36 pKa = 11.84FNLLRR41 pKa = 11.84RR42 pKa = 11.84HH43 pKa = 4.95WRR45 pKa = 11.84RR46 pKa = 11.84SKK48 pKa = 11.16LKK50 pKa = 9.99VV51 pKa = 3.04
Molecular weight: 6.25 kDa
Isoelectric point according different methods:
Peptides (in silico digests for buttom-up proteomics)
Below you can find in silico digests of the whole proteome with Trypsin, Chymotrypsin, Trypsin+LysC, LysN, ArgC proteases suitable for different mass spec machines.| Try ESI |
 |
|---|
| ChTry ESI |
 |
|---|
| ArgC ESI |
 |
|---|
| LysN ESI |
 |
|---|
| TryLysC ESI |
 |
|---|
| Try MALDI |
 |
|---|
| ChTry MALDI |
 |
|---|
| ArgC MALDI |
 |
|---|
| LysN MALDI |
 |
|---|
| TryLysC MALDI |
 |
|---|
| Try LTQ |
 |
|---|
| ChTry LTQ |
 |
|---|
| ArgC LTQ |
 |
|---|
| LysN LTQ |
 |
|---|
| TryLysC LTQ |
 |
|---|
| Try MSlow |
 |
|---|
| ChTry MSlow |
 |
|---|
| ArgC MSlow |
 |
|---|
| LysN MSlow |
 |
|---|
| TryLysC MSlow |
 |
|---|
| Try MShigh |
 |
|---|
| ChTry MShigh |
 |
|---|
| ArgC MShigh |
 |
|---|
| LysN MShigh |
 |
|---|
| TryLysC MShigh |
 |
|---|
General Statistics
Number of major isoforms |
Number of additional isoforms |
Number of all proteins |
Number of amino acids |
Min. Seq. Length |
Max. Seq. Length |
Avg. Seq. Length |
Avg. Mol. Weight |
|---|---|---|---|---|---|---|---|
0 |
492043 |
30 |
1950 |
289.4 |
31.8 |
Amino acid frequency
Ala |
Cys |
Asp |
Glu |
Phe |
Gly |
His |
Ile |
Lys |
Leu |
|---|---|---|---|---|---|---|---|---|---|
9.767 ± 0.068 | 0.672 ± 0.022 |
4.389 ± 0.042 | 7.65 ± 0.064 |
2.934 ± 0.039 | 8.867 ± 0.064 |
1.501 ± 0.022 | 5.691 ± 0.055 |
4.143 ± 0.06 | 11.061 ± 0.061 |
Met |
Asn |
Gln |
Pro |
Arg |
Ser |
Thr |
Val |
Trp |
Tyr |
|---|---|---|---|---|---|---|---|---|---|
2.211 ± 0.021 | 1.939 ± 0.029 |
5.104 ± 0.043 | 1.686 ± 0.028 |
7.768 ± 0.084 | 6.264 ± 0.061 |
4.205 ± 0.048 | 9.269 ± 0.058 |
1.319 ± 0.027 | 3.561 ± 0.039 |
Most of the basic statistics you can see at this page can be downloaded from this CSV file
Proteome-pI is available under Creative Commons Attribution-NoDerivs license, for more details see here
| Reference: Kozlowski LP. Proteome-pI 2.0: Proteome Isoelectric Point Database Update. Nucleic Acids Res. 2021, doi: 10.1093/nar/gkab944 | Contact: Lukasz P. Kozlowski |
