Marssonina coronariae
Taxonomy: cellular organisms; Eukaryota; Opisthokonta; Fungi; Dikarya; Ascomycota; saccharomyceta; Pezizomycotina; leotiomyceta; sordariomyceta; Leotiomycetes; Helotiales; Dermateaceae; Marssonina
Average proteome isoelectric point is 6.78
Get precalculated fractions of proteins

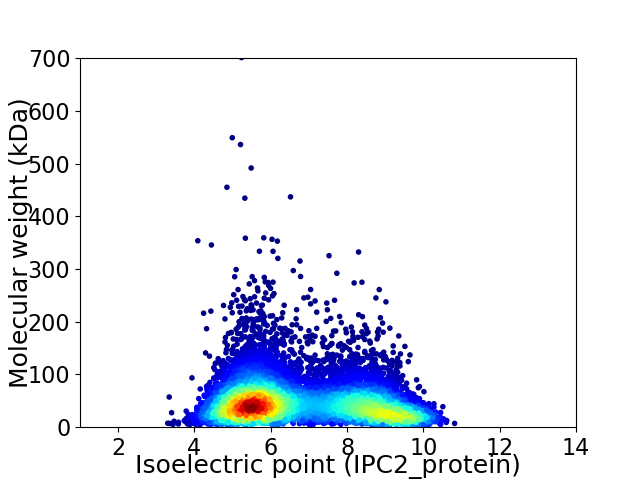
Virtual 2D-PAGE plot for 9355 proteins (isoelectric point calculated using IPC2_protein)
Get csv file with sequences according to given criteria:
* You can choose from 21 different methods for calculating isoelectric point
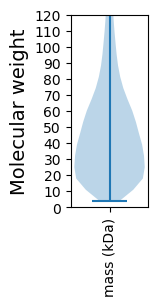
Summary statistics related to proteome-wise predictions


Protein with the lowest isoelectric point:
>tr|A0A218Z6W4|A0A218Z6W4_9HELO Septin-type G domain-containing protein OS=Marssonina coronariae OX=503106 GN=B2J93_6081 PE=3 SV=1
MM1 pKa = 6.72QTTLTLAALASAAWAFPHH19 pKa = 6.1VARR22 pKa = 11.84DD23 pKa = 3.75APAGCSTSYY32 pKa = 10.89EE33 pKa = 3.92GDD35 pKa = 3.57FQITILNGSSIITKK49 pKa = 9.83RR50 pKa = 11.84DD51 pKa = 3.14LGEE54 pKa = 4.27RR55 pKa = 11.84AASTCGQEE63 pKa = 4.78GYY65 pKa = 8.48LTATLKK71 pKa = 10.93DD72 pKa = 3.51GNLIDD77 pKa = 3.6NKK79 pKa = 10.44GRR81 pKa = 11.84IGSIVANRR89 pKa = 11.84QFQFDD94 pKa = 4.28GPPAQSGAVYY104 pKa = 9.4TNGWSVCSNGSLATSAGSTLFYY126 pKa = 10.37SCKK129 pKa = 10.27SGEE132 pKa = 4.04FANLYY137 pKa = 10.04DD138 pKa = 3.88EE139 pKa = 5.95SVAEE143 pKa = 4.14YY144 pKa = 10.01CLPVYY149 pKa = 10.34IDD151 pKa = 4.7VIPCSSAAATGAVPQQADD169 pKa = 4.03GQPTATTAVAPVTQIADD186 pKa = 3.74GQPQGKK192 pKa = 6.88PTAPAVTQIGDD203 pKa = 3.68GQLQGMPAVTQIADD217 pKa = 3.73GQLQIPTGAPTAITQIADD235 pKa = 3.73GQVQAPATAGAPAATQITDD254 pKa = 3.54GQVQVPTTAAAPATQIGDD272 pKa = 3.66GQVQVPTVAPTAGATQISDD291 pKa = 3.52GQVQVPTAVSGPAVSQIPDD310 pKa = 3.26GQLQSNVSTSATPRR324 pKa = 11.84PIAVSAAVANSPLFVSALGSAALGFAAVILLL355 pKa = 3.96
MM1 pKa = 6.72QTTLTLAALASAAWAFPHH19 pKa = 6.1VARR22 pKa = 11.84DD23 pKa = 3.75APAGCSTSYY32 pKa = 10.89EE33 pKa = 3.92GDD35 pKa = 3.57FQITILNGSSIITKK49 pKa = 9.83RR50 pKa = 11.84DD51 pKa = 3.14LGEE54 pKa = 4.27RR55 pKa = 11.84AASTCGQEE63 pKa = 4.78GYY65 pKa = 8.48LTATLKK71 pKa = 10.93DD72 pKa = 3.51GNLIDD77 pKa = 3.6NKK79 pKa = 10.44GRR81 pKa = 11.84IGSIVANRR89 pKa = 11.84QFQFDD94 pKa = 4.28GPPAQSGAVYY104 pKa = 9.4TNGWSVCSNGSLATSAGSTLFYY126 pKa = 10.37SCKK129 pKa = 10.27SGEE132 pKa = 4.04FANLYY137 pKa = 10.04DD138 pKa = 3.88EE139 pKa = 5.95SVAEE143 pKa = 4.14YY144 pKa = 10.01CLPVYY149 pKa = 10.34IDD151 pKa = 4.7VIPCSSAAATGAVPQQADD169 pKa = 4.03GQPTATTAVAPVTQIADD186 pKa = 3.74GQPQGKK192 pKa = 6.88PTAPAVTQIGDD203 pKa = 3.68GQLQGMPAVTQIADD217 pKa = 3.73GQLQIPTGAPTAITQIADD235 pKa = 3.73GQVQAPATAGAPAATQITDD254 pKa = 3.54GQVQVPTTAAAPATQIGDD272 pKa = 3.66GQVQVPTVAPTAGATQISDD291 pKa = 3.52GQVQVPTAVSGPAVSQIPDD310 pKa = 3.26GQLQSNVSTSATPRR324 pKa = 11.84PIAVSAAVANSPLFVSALGSAALGFAAVILLL355 pKa = 3.96
Molecular weight: 35.47 kDa
Isoelectric point according different methods:
Protein with the highest isoelectric point:
>tr|A0A218YX69|A0A218YX69_9HELO Uncharacterized protein OS=Marssonina coronariae OX=503106 GN=B2J93_9443 PE=4 SV=1
MM1 pKa = 7.0PQPRR5 pKa = 11.84RR6 pKa = 11.84RR7 pKa = 11.84LWTLEE12 pKa = 3.86SGSTSKK18 pKa = 11.21VNVRR22 pKa = 11.84ASVKK26 pKa = 9.67VNLRR30 pKa = 11.84ASIKK34 pKa = 9.52VSIRR38 pKa = 11.84ASIKK42 pKa = 8.8VSIRR46 pKa = 11.84ASIKK50 pKa = 9.6VNLTARR56 pKa = 11.84IKK58 pKa = 10.41VNHH61 pKa = 6.26PRR63 pKa = 11.84FF64 pKa = 3.68
MM1 pKa = 7.0PQPRR5 pKa = 11.84RR6 pKa = 11.84RR7 pKa = 11.84LWTLEE12 pKa = 3.86SGSTSKK18 pKa = 11.21VNVRR22 pKa = 11.84ASVKK26 pKa = 9.67VNLRR30 pKa = 11.84ASIKK34 pKa = 9.52VSIRR38 pKa = 11.84ASIKK42 pKa = 8.8VSIRR46 pKa = 11.84ASIKK50 pKa = 9.6VNLTARR56 pKa = 11.84IKK58 pKa = 10.41VNHH61 pKa = 6.26PRR63 pKa = 11.84FF64 pKa = 3.68
Molecular weight: 7.22 kDa
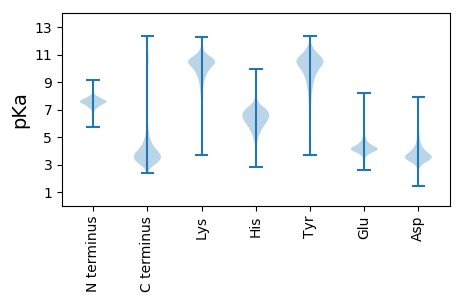
Isoelectric point according different methods:
Peptides (in silico digests for buttom-up proteomics)
Below you can find in silico digests of the whole proteome with Trypsin, Chymotrypsin, Trypsin+LysC, LysN, ArgC proteases suitable for different mass spec machines.| Try ESI |
 |
|---|
| ChTry ESI |
 |
|---|
| ArgC ESI |
 |
|---|
| LysN ESI |
 |
|---|
| TryLysC ESI |
 |
|---|
| Try MALDI |
 |
|---|
| ChTry MALDI |
 |
|---|
| ArgC MALDI |
 |
|---|
| LysN MALDI |
 |
|---|
| TryLysC MALDI |
 |
|---|
| Try LTQ |
 |
|---|
| ChTry LTQ |
 |
|---|
| ArgC LTQ |
 |
|---|
| LysN LTQ |
 |
|---|
| TryLysC LTQ |
 |
|---|
| Try MSlow |
 |
|---|
| ChTry MSlow |
 |
|---|
| ArgC MSlow |
 |
|---|
| LysN MSlow |
 |
|---|
| TryLysC MSlow |
 |
|---|
| Try MShigh |
 |
|---|
| ChTry MShigh |
 |
|---|
| ArgC MShigh |
 |
|---|
| LysN MShigh |
 |
|---|
| TryLysC MShigh |
 |
|---|
General Statistics
Number of major isoforms |
Number of additional isoforms |
Number of all proteins |
Number of amino acids |
Min. Seq. Length |
Max. Seq. Length |
Avg. Seq. Length |
Avg. Mol. Weight |
|---|---|---|---|---|---|---|---|
0 |
4461638 |
39 |
6376 |
476.9 |
52.51 |
Amino acid frequency
Ala |
Cys |
Asp |
Glu |
Phe |
Gly |
His |
Ile |
Lys |
Leu |
|---|---|---|---|---|---|---|---|---|---|
8.962 ± 0.023 | 1.137 ± 0.009 |
5.474 ± 0.018 | 6.344 ± 0.028 |
3.538 ± 0.016 | 7.196 ± 0.028 |
2.302 ± 0.011 | 4.757 ± 0.017 |
5.002 ± 0.026 | 8.702 ± 0.03 |
Met |
Asn |
Gln |
Pro |
Arg |
Ser |
Thr |
Val |
Trp |
Tyr |
|---|---|---|---|---|---|---|---|---|---|
2.122 ± 0.01 | 3.522 ± 0.014 |
6.304 ± 0.028 | 3.871 ± 0.017 |
6.392 ± 0.022 | 8.622 ± 0.036 |
5.842 ± 0.016 | 6.011 ± 0.017 |
1.337 ± 0.008 | 2.562 ± 0.013 |
Most of the basic statistics you can see at this page can be downloaded from this CSV file
Proteome-pI is available under Creative Commons Attribution-NoDerivs license, for more details see here
| Reference: Kozlowski LP. Proteome-pI 2.0: Proteome Isoelectric Point Database Update. Nucleic Acids Res. 2021, doi: 10.1093/nar/gkab944 | Contact: Lukasz P. Kozlowski |
