Synechococcus phage S-CAM1
Taxonomy: Viruses; Duplodnaviria; Heunggongvirae; Uroviricota; Caudoviricetes; Caudovirales; Myoviridae; Anaposvirus; Synechococcus virus SCAM1
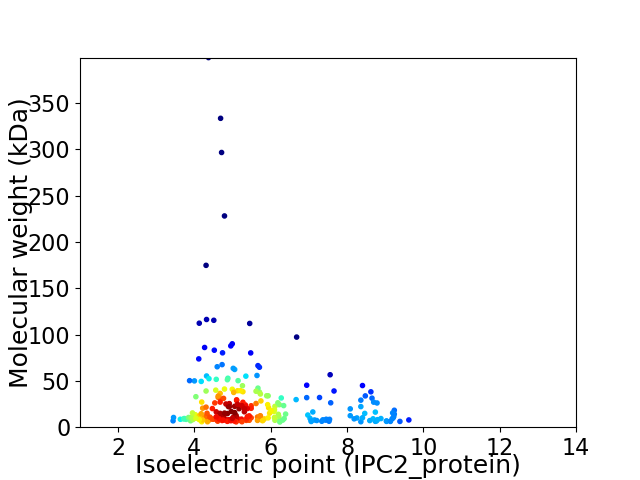
Average proteome isoelectric point is 5.72
Get precalculated fractions of proteins

Virtual 2D-PAGE plot for 231 proteins (isoelectric point calculated using IPC2_protein)
Get csv file with sequences according to given criteria:
* You can choose from 21 different methods for calculating isoelectric point
Summary statistics related to proteome-wise predictions


Protein with the lowest isoelectric point:
>tr|M4QRV9|M4QRV9_9CAUD Uncharacterized protein OS=Synechococcus phage S-CAM1 OX=754037 GN=C030809_014 PE=4 SV=1
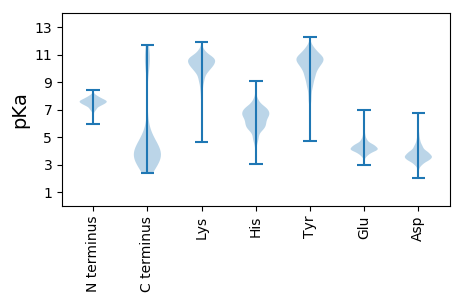
MM1 pKa = 7.66PSINISWQRR10 pKa = 11.84SAGDD14 pKa = 3.29SNYY17 pKa = 9.94IYY19 pKa = 10.79GMPGGTIGPNSGSRR33 pKa = 11.84SVNVGFGQTYY43 pKa = 9.67NLSSSGSGPGNTALRR58 pKa = 11.84RR59 pKa = 11.84LNSQTLGLDD68 pKa = 3.47DD69 pKa = 4.2RR70 pKa = 11.84QGAGADD76 pKa = 3.23NDD78 pKa = 4.03YY79 pKa = 11.24NDD81 pKa = 3.92MIVYY85 pKa = 9.89VSGGGTFTGNSTFSGPPATYY105 pKa = 10.72GCMDD109 pKa = 4.43SNAVNYY115 pKa = 10.15NSSANVNSGCIYY127 pKa = 10.91ANPNPQLTVNGSTATQTIVEE147 pKa = 4.38GDD149 pKa = 4.27AITVSWSANDD159 pKa = 3.51SQYY162 pKa = 10.65MYY164 pKa = 9.36TGSISGQGAPGSLSSSQYY182 pKa = 10.38GGGSFVANPTSNTTYY197 pKa = 9.65TYY199 pKa = 10.11SVSYY203 pKa = 10.7APPTRR208 pKa = 11.84NDD210 pKa = 3.37SFSVPVNVKK219 pKa = 9.66EE220 pKa = 3.94IPEE223 pKa = 4.47IIASFPNGSTILRR236 pKa = 11.84GNSTNLVWSTSGDD249 pKa = 3.43ATTMSISPGLGLQNLSGTLSLSPTEE274 pKa = 4.13TTTYY278 pKa = 9.81TLYY281 pKa = 10.89ASSPGYY287 pKa = 10.23GGRR290 pKa = 11.84LQDD293 pKa = 4.18SVSLLLTVIQPPSASLTIPSTIDD316 pKa = 2.74WGDD319 pKa = 3.31SSFQAILEE327 pKa = 4.06FDD329 pKa = 3.66EE330 pKa = 4.44VTSYY334 pKa = 11.8DD335 pKa = 3.59LTVEE339 pKa = 4.14YY340 pKa = 10.54TDD342 pKa = 4.75LDD344 pKa = 3.9GVMITHH350 pKa = 7.48PAFTGADD357 pKa = 3.56PSQTTVNLLIGDD369 pKa = 4.17EE370 pKa = 4.41TSGTIPRR377 pKa = 11.84WNNRR381 pKa = 11.84GYY383 pKa = 10.49SQGKK387 pKa = 9.54VKK389 pKa = 10.15MKK391 pKa = 10.49AYY393 pKa = 10.16GLGGQFVEE401 pKa = 5.15KK402 pKa = 10.61EE403 pKa = 4.24SIFNINIDD411 pKa = 3.79QMPDD415 pKa = 3.31AIDD418 pKa = 3.67IPSSEE423 pKa = 4.35DD424 pKa = 3.01KK425 pKa = 11.01FLGEE429 pKa = 4.62EE430 pKa = 4.11PVITPDD436 pKa = 3.2VTVTSEE442 pKa = 3.99QIVIDD447 pKa = 4.26DD448 pKa = 3.24VDD450 pKa = 3.74IPVEE454 pKa = 4.46VKK456 pKa = 10.38ASSPIQVEE464 pKa = 3.83IDD466 pKa = 4.59DD467 pKa = 4.28GGVWYY472 pKa = 10.43NVRR475 pKa = 11.84QTT477 pKa = 3.32
MM1 pKa = 7.66PSINISWQRR10 pKa = 11.84SAGDD14 pKa = 3.29SNYY17 pKa = 9.94IYY19 pKa = 10.79GMPGGTIGPNSGSRR33 pKa = 11.84SVNVGFGQTYY43 pKa = 9.67NLSSSGSGPGNTALRR58 pKa = 11.84RR59 pKa = 11.84LNSQTLGLDD68 pKa = 3.47DD69 pKa = 4.2RR70 pKa = 11.84QGAGADD76 pKa = 3.23NDD78 pKa = 4.03YY79 pKa = 11.24NDD81 pKa = 3.92MIVYY85 pKa = 9.89VSGGGTFTGNSTFSGPPATYY105 pKa = 10.72GCMDD109 pKa = 4.43SNAVNYY115 pKa = 10.15NSSANVNSGCIYY127 pKa = 10.91ANPNPQLTVNGSTATQTIVEE147 pKa = 4.38GDD149 pKa = 4.27AITVSWSANDD159 pKa = 3.51SQYY162 pKa = 10.65MYY164 pKa = 9.36TGSISGQGAPGSLSSSQYY182 pKa = 10.38GGGSFVANPTSNTTYY197 pKa = 9.65TYY199 pKa = 10.11SVSYY203 pKa = 10.7APPTRR208 pKa = 11.84NDD210 pKa = 3.37SFSVPVNVKK219 pKa = 9.66EE220 pKa = 3.94IPEE223 pKa = 4.47IIASFPNGSTILRR236 pKa = 11.84GNSTNLVWSTSGDD249 pKa = 3.43ATTMSISPGLGLQNLSGTLSLSPTEE274 pKa = 4.13TTTYY278 pKa = 9.81TLYY281 pKa = 10.89ASSPGYY287 pKa = 10.23GGRR290 pKa = 11.84LQDD293 pKa = 4.18SVSLLLTVIQPPSASLTIPSTIDD316 pKa = 2.74WGDD319 pKa = 3.31SSFQAILEE327 pKa = 4.06FDD329 pKa = 3.66EE330 pKa = 4.44VTSYY334 pKa = 11.8DD335 pKa = 3.59LTVEE339 pKa = 4.14YY340 pKa = 10.54TDD342 pKa = 4.75LDD344 pKa = 3.9GVMITHH350 pKa = 7.48PAFTGADD357 pKa = 3.56PSQTTVNLLIGDD369 pKa = 4.17EE370 pKa = 4.41TSGTIPRR377 pKa = 11.84WNNRR381 pKa = 11.84GYY383 pKa = 10.49SQGKK387 pKa = 9.54VKK389 pKa = 10.15MKK391 pKa = 10.49AYY393 pKa = 10.16GLGGQFVEE401 pKa = 5.15KK402 pKa = 10.61EE403 pKa = 4.24SIFNINIDD411 pKa = 3.79QMPDD415 pKa = 3.31AIDD418 pKa = 3.67IPSSEE423 pKa = 4.35DD424 pKa = 3.01KK425 pKa = 11.01FLGEE429 pKa = 4.62EE430 pKa = 4.11PVITPDD436 pKa = 3.2VTVTSEE442 pKa = 3.99QIVIDD447 pKa = 4.26DD448 pKa = 3.24VDD450 pKa = 3.74IPVEE454 pKa = 4.46VKK456 pKa = 10.38ASSPIQVEE464 pKa = 3.83IDD466 pKa = 4.59DD467 pKa = 4.28GGVWYY472 pKa = 10.43NVRR475 pKa = 11.84QTT477 pKa = 3.32
Molecular weight: 50.23 kDa
Isoelectric point according different methods:
Protein with the highest isoelectric point:
>tr|M4QRR5|M4QRR5_9CAUD Uncharacterized protein OS=Synechococcus phage S-CAM1 OX=754037 GN=C030809_067 PE=4 SV=1
MM1 pKa = 7.58INVSCISPRR10 pKa = 11.84PSRR13 pKa = 11.84SVWTLKK19 pKa = 10.63VNPFTGTCAVRR30 pKa = 11.84WFKK33 pKa = 10.57TPSAEE38 pKa = 4.16YY39 pKa = 9.74TFKK42 pKa = 10.48TRR44 pKa = 11.84KK45 pKa = 9.36RR46 pKa = 11.84DD47 pKa = 3.33ILALMMAGDD56 pKa = 4.06RR57 pKa = 11.84SLGQWVNYY65 pKa = 9.48HH66 pKa = 5.52MAA68 pKa = 4.45
MM1 pKa = 7.58INVSCISPRR10 pKa = 11.84PSRR13 pKa = 11.84SVWTLKK19 pKa = 10.63VNPFTGTCAVRR30 pKa = 11.84WFKK33 pKa = 10.57TPSAEE38 pKa = 4.16YY39 pKa = 9.74TFKK42 pKa = 10.48TRR44 pKa = 11.84KK45 pKa = 9.36RR46 pKa = 11.84DD47 pKa = 3.33ILALMMAGDD56 pKa = 4.06RR57 pKa = 11.84SLGQWVNYY65 pKa = 9.48HH66 pKa = 5.52MAA68 pKa = 4.45
Molecular weight: 7.82 kDa
Isoelectric point according different methods:
Peptides (in silico digests for buttom-up proteomics)
Below you can find in silico digests of the whole proteome with Trypsin, Chymotrypsin, Trypsin+LysC, LysN, ArgC proteases suitable for different mass spec machines.| Try ESI |
 |
|---|
| ChTry ESI |
 |
|---|
| ArgC ESI |
 |
|---|
| LysN ESI |
 |
|---|
| TryLysC ESI |
 |
|---|
| Try MALDI |
 |
|---|
| ChTry MALDI |
 |
|---|
| ArgC MALDI |
 |
|---|
| LysN MALDI |
 |
|---|
| TryLysC MALDI |
 |
|---|
| Try LTQ |
 |
|---|
| ChTry LTQ |
 |
|---|
| ArgC LTQ |
 |
|---|
| LysN LTQ |
 |
|---|
| TryLysC LTQ |
 |
|---|
| Try MSlow |
 |
|---|
| ChTry MSlow |
 |
|---|
| ArgC MSlow |
 |
|---|
| LysN MSlow |
 |
|---|
| TryLysC MSlow |
 |
|---|
| Try MShigh |
 |
|---|
| ChTry MShigh |
 |
|---|
| ArgC MShigh |
 |
|---|
| LysN MShigh |
 |
|---|
| TryLysC MShigh |
 |
|---|
General Statistics
Number of major isoforms |
Number of additional isoforms |
Number of all proteins |
Number of amino acids |
Min. Seq. Length |
Max. Seq. Length |
Avg. Seq. Length |
Avg. Mol. Weight |
|---|---|---|---|---|---|---|---|
0 |
62223 |
49 |
3693 |
269.4 |
29.87 |
Amino acid frequency
Ala |
Cys |
Asp |
Glu |
Phe |
Gly |
His |
Ile |
Lys |
Leu |
|---|---|---|---|---|---|---|---|---|---|
6.878 ± 0.258 | 0.963 ± 0.125 |
6.711 ± 0.147 | 6.147 ± 0.206 |
4.37 ± 0.139 | 8.174 ± 0.287 |
1.589 ± 0.115 | 6.223 ± 0.17 |
5.495 ± 0.3 | 7.094 ± 0.161 |
Met |
Asn |
Gln |
Pro |
Arg |
Ser |
Thr |
Val |
Trp |
Tyr |
|---|---|---|---|---|---|---|---|---|---|
2.131 ± 0.17 | 5.628 ± 0.172 |
4.179 ± 0.113 | 3.574 ± 0.106 |
4.105 ± 0.103 | 7.033 ± 0.22 |
7.394 ± 0.297 | 6.792 ± 0.153 |
1.176 ± 0.082 | 4.344 ± 0.142 |
Most of the basic statistics you can see at this page can be downloaded from this CSV file
Proteome-pI is available under Creative Commons Attribution-NoDerivs license, for more details see here
| Reference: Kozlowski LP. Proteome-pI 2.0: Proteome Isoelectric Point Database Update. Nucleic Acids Res. 2021, doi: 10.1093/nar/gkab944 | Contact: Lukasz P. Kozlowski |
