Onion yellows phytoplasma (strain OY-M)
Taxonomy: cellular organisms; Bacteria; Terrabacteria group; Tenericutes; Mollicutes; Acholeplasmatales; Acholeplasmataceae; Candidatus Phytoplasma; Candidatus Phytoplasma asteris; Onion yellows phytoplasma
Average proteome isoelectric point is 7.9
Get precalculated fractions of proteins

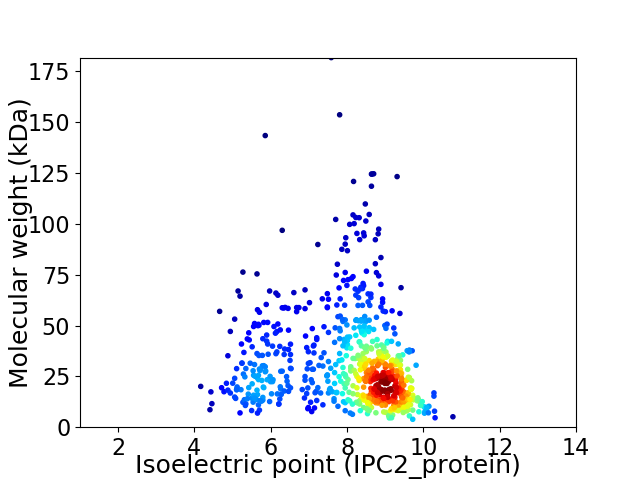
Virtual 2D-PAGE plot for 730 proteins (isoelectric point calculated using IPC2_protein)
Get csv file with sequences according to given criteria:
* You can choose from 21 different methods for calculating isoelectric point
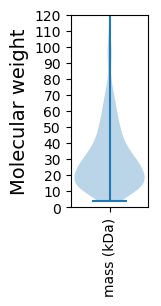
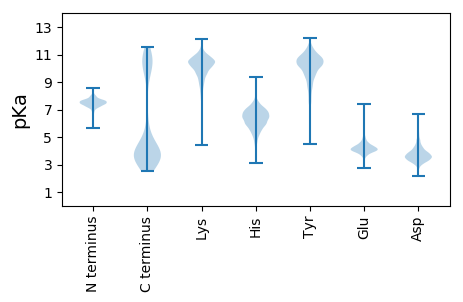
Summary statistics related to proteome-wise predictions


Protein with the lowest isoelectric point:
>tr|Q6YQI8|Q6YQI8_ONYPE HTH_21 domain-containing protein OS=Onion yellows phytoplasma (strain OY-M) OX=262768 GN=PAM_385 PE=4 SV=1
MM1 pKa = 7.4INKK4 pKa = 6.35TTIYY8 pKa = 10.42YY9 pKa = 10.31RR10 pKa = 11.84ADD12 pKa = 3.07KK13 pKa = 10.16TIDD16 pKa = 3.41YY17 pKa = 10.47IFEE20 pKa = 4.24NDD22 pKa = 3.72KK23 pKa = 9.46EE24 pKa = 4.25TGYY27 pKa = 10.34IIKK30 pKa = 8.71KK31 pKa = 6.82TQYY34 pKa = 10.49QSDD37 pKa = 4.13GTNIDD42 pKa = 3.66YY43 pKa = 10.97VSEE46 pKa = 4.08YY47 pKa = 11.2DD48 pKa = 3.47KK49 pKa = 11.23DD50 pKa = 3.37TGQEE54 pKa = 4.04VKK56 pKa = 8.92VTFYY60 pKa = 10.92QFDD63 pKa = 3.74GKK65 pKa = 9.25TIEE68 pKa = 5.69CIAEE72 pKa = 3.96YY73 pKa = 10.92DD74 pKa = 3.47KK75 pKa = 11.13GTCKK79 pKa = 10.11LVKK82 pKa = 9.72DD83 pKa = 3.69TTYY86 pKa = 11.08QSDD89 pKa = 3.28GKK91 pKa = 8.78TIRR94 pKa = 11.84KK95 pKa = 8.65INEE98 pKa = 3.82YY99 pKa = 9.61NQSTGEE105 pKa = 4.21SIKK108 pKa = 10.64DD109 pKa = 2.86IYY111 pKa = 9.89YY112 pKa = 10.57QIDD115 pKa = 3.91GKK117 pKa = 9.42TIAYY121 pKa = 9.36VNEE124 pKa = 3.91YY125 pKa = 10.36DD126 pKa = 5.37DD127 pKa = 5.32NGTLIQTIYY136 pKa = 10.86YY137 pKa = 10.0NDD139 pKa = 4.48DD140 pKa = 3.44GTVKK144 pKa = 10.74DD145 pKa = 4.54IINFF149 pKa = 3.62
MM1 pKa = 7.4INKK4 pKa = 6.35TTIYY8 pKa = 10.42YY9 pKa = 10.31RR10 pKa = 11.84ADD12 pKa = 3.07KK13 pKa = 10.16TIDD16 pKa = 3.41YY17 pKa = 10.47IFEE20 pKa = 4.24NDD22 pKa = 3.72KK23 pKa = 9.46EE24 pKa = 4.25TGYY27 pKa = 10.34IIKK30 pKa = 8.71KK31 pKa = 6.82TQYY34 pKa = 10.49QSDD37 pKa = 4.13GTNIDD42 pKa = 3.66YY43 pKa = 10.97VSEE46 pKa = 4.08YY47 pKa = 11.2DD48 pKa = 3.47KK49 pKa = 11.23DD50 pKa = 3.37TGQEE54 pKa = 4.04VKK56 pKa = 8.92VTFYY60 pKa = 10.92QFDD63 pKa = 3.74GKK65 pKa = 9.25TIEE68 pKa = 5.69CIAEE72 pKa = 3.96YY73 pKa = 10.92DD74 pKa = 3.47KK75 pKa = 11.13GTCKK79 pKa = 10.11LVKK82 pKa = 9.72DD83 pKa = 3.69TTYY86 pKa = 11.08QSDD89 pKa = 3.28GKK91 pKa = 8.78TIRR94 pKa = 11.84KK95 pKa = 8.65INEE98 pKa = 3.82YY99 pKa = 9.61NQSTGEE105 pKa = 4.21SIKK108 pKa = 10.64DD109 pKa = 2.86IYY111 pKa = 9.89YY112 pKa = 10.57QIDD115 pKa = 3.91GKK117 pKa = 9.42TIAYY121 pKa = 9.36VNEE124 pKa = 3.91YY125 pKa = 10.36DD126 pKa = 5.37DD127 pKa = 5.32NGTLIQTIYY136 pKa = 10.86YY137 pKa = 10.0NDD139 pKa = 4.48DD140 pKa = 3.44GTVKK144 pKa = 10.74DD145 pKa = 4.54IINFF149 pKa = 3.62
Molecular weight: 17.38 kDa
Isoelectric point according different methods:
Protein with the highest isoelectric point:
>tr|Q6YQ94|Q6YQ94_ONYPE Uncharacterized protein OS=Onion yellows phytoplasma (strain OY-M) OX=262768 GN=PAM_481 PE=4 SV=1
MM1 pKa = 7.28SHH3 pKa = 6.62GPSIRR8 pKa = 11.84YY9 pKa = 9.04RR10 pKa = 11.84KK11 pKa = 7.8ITKK14 pKa = 9.94SDD16 pKa = 3.57FRR18 pKa = 11.84PCSTCKK24 pKa = 10.39SCSQAPLCLYY34 pKa = 9.88ALQMISNHH42 pKa = 5.76FEE44 pKa = 3.88GTFEE48 pKa = 4.11RR49 pKa = 11.84LRR51 pKa = 11.84YY52 pKa = 9.78SLGGDD57 pKa = 3.29RR58 pKa = 11.84PSQTAHH64 pKa = 4.6QTLSLTLHH72 pKa = 5.84MCRR75 pKa = 11.84LEE77 pKa = 4.14TKK79 pKa = 9.51NNKK82 pKa = 9.71GGIPRR87 pKa = 11.84TTPEE91 pKa = 3.47KK92 pKa = 10.63LAFFSHH98 pKa = 6.57SFPPILYY105 pKa = 8.79ILFPISILSCSKK117 pKa = 10.87APWGLFVLSRR127 pKa = 11.84VTGIFTGNLISPRR140 pKa = 11.84LLLRR144 pKa = 11.84QRR146 pKa = 11.84PNRR149 pKa = 11.84YY150 pKa = 9.4AFRR153 pKa = 11.84AGRR156 pKa = 11.84NLPDD160 pKa = 3.22KK161 pKa = 10.12EE162 pKa = 3.91FRR164 pKa = 11.84YY165 pKa = 10.28LRR167 pKa = 11.84TVIVTAAVYY176 pKa = 10.0WDD178 pKa = 4.11FNSMLRR184 pKa = 11.84CLTSPFNLPAPGRR197 pKa = 11.84HH198 pKa = 4.28QPLYY202 pKa = 7.94ITLRR206 pKa = 11.84FSRR209 pKa = 11.84DD210 pKa = 2.82LCFF213 pKa = 4.91
MM1 pKa = 7.28SHH3 pKa = 6.62GPSIRR8 pKa = 11.84YY9 pKa = 9.04RR10 pKa = 11.84KK11 pKa = 7.8ITKK14 pKa = 9.94SDD16 pKa = 3.57FRR18 pKa = 11.84PCSTCKK24 pKa = 10.39SCSQAPLCLYY34 pKa = 9.88ALQMISNHH42 pKa = 5.76FEE44 pKa = 3.88GTFEE48 pKa = 4.11RR49 pKa = 11.84LRR51 pKa = 11.84YY52 pKa = 9.78SLGGDD57 pKa = 3.29RR58 pKa = 11.84PSQTAHH64 pKa = 4.6QTLSLTLHH72 pKa = 5.84MCRR75 pKa = 11.84LEE77 pKa = 4.14TKK79 pKa = 9.51NNKK82 pKa = 9.71GGIPRR87 pKa = 11.84TTPEE91 pKa = 3.47KK92 pKa = 10.63LAFFSHH98 pKa = 6.57SFPPILYY105 pKa = 8.79ILFPISILSCSKK117 pKa = 10.87APWGLFVLSRR127 pKa = 11.84VTGIFTGNLISPRR140 pKa = 11.84LLLRR144 pKa = 11.84QRR146 pKa = 11.84PNRR149 pKa = 11.84YY150 pKa = 9.4AFRR153 pKa = 11.84AGRR156 pKa = 11.84NLPDD160 pKa = 3.22KK161 pKa = 10.12EE162 pKa = 3.91FRR164 pKa = 11.84YY165 pKa = 10.28LRR167 pKa = 11.84TVIVTAAVYY176 pKa = 10.0WDD178 pKa = 4.11FNSMLRR184 pKa = 11.84CLTSPFNLPAPGRR197 pKa = 11.84HH198 pKa = 4.28QPLYY202 pKa = 7.94ITLRR206 pKa = 11.84FSRR209 pKa = 11.84DD210 pKa = 2.82LCFF213 pKa = 4.91
Molecular weight: 24.44 kDa
Isoelectric point according different methods:
Peptides (in silico digests for buttom-up proteomics)
Below you can find in silico digests of the whole proteome with Trypsin, Chymotrypsin, Trypsin+LysC, LysN, ArgC proteases suitable for different mass spec machines.| Try ESI |
 |
|---|
| ChTry ESI |
 |
|---|
| ArgC ESI |
 |
|---|
| LysN ESI |
 |
|---|
| TryLysC ESI |
 |
|---|
| Try MALDI |
 |
|---|
| ChTry MALDI |
 |
|---|
| ArgC MALDI |
 |
|---|
| LysN MALDI |
 |
|---|
| TryLysC MALDI |
 |
|---|
| Try LTQ |
 |
|---|
| ChTry LTQ |
 |
|---|
| ArgC LTQ |
 |
|---|
| LysN LTQ |
 |
|---|
| TryLysC LTQ |
 |
|---|
| Try MSlow |
 |
|---|
| ChTry MSlow |
 |
|---|
| ArgC MSlow |
 |
|---|
| LysN MSlow |
 |
|---|
| TryLysC MSlow |
 |
|---|
| Try MShigh |
 |
|---|
| ChTry MShigh |
 |
|---|
| ArgC MShigh |
 |
|---|
| LysN MShigh |
 |
|---|
| TryLysC MShigh |
 |
|---|
General Statistics
Number of major isoforms |
Number of additional isoforms |
Number of all proteins |
Number of amino acids |
Min. Seq. Length |
Max. Seq. Length |
Avg. Seq. Length |
Avg. Mol. Weight |
|---|---|---|---|---|---|---|---|
0 |
204107 |
33 |
1571 |
279.6 |
32.3 |
Amino acid frequency
Ala |
Cys |
Asp |
Glu |
Phe |
Gly |
His |
Ile |
Lys |
Leu |
|---|---|---|---|---|---|---|---|---|---|
4.51 ± 0.097 | 1.036 ± 0.031 |
4.597 ± 0.066 | 6.014 ± 0.1 |
5.69 ± 0.107 | 4.242 ± 0.081 |
2.056 ± 0.042 | 8.882 ± 0.097 |
10.788 ± 0.119 | 10.839 ± 0.099 |
Met |
Asn |
Gln |
Pro |
Arg |
Ser |
Thr |
Val |
Trp |
Tyr |
|---|---|---|---|---|---|---|---|---|---|
1.858 ± 0.035 | 7.078 ± 0.092 |
3.263 ± 0.053 | 5.866 ± 0.105 |
2.642 ± 0.053 | 5.441 ± 0.066 |
5.884 ± 0.065 | 4.678 ± 0.096 |
0.64 ± 0.022 | 3.994 ± 0.076 |
Most of the basic statistics you can see at this page can be downloaded from this CSV file
Proteome-pI is available under Creative Commons Attribution-NoDerivs license, for more details see here
| Reference: Kozlowski LP. Proteome-pI 2.0: Proteome Isoelectric Point Database Update. Nucleic Acids Res. 2021, doi: 10.1093/nar/gkab944 | Contact: Lukasz P. Kozlowski |
