Monosporascus sp. 5C6A
Taxonomy: cellular organisms; Eukaryota; Opisthokonta; Fungi; Dikarya; Ascomycota; saccharomyceta; Pezizomycotina; leotiomyceta; sordariomyceta; Sordariomycetes; Xylariomycetidae; Xylariales; Xylariales incertae sedis; Monosporascus; unclassified Monosporascus
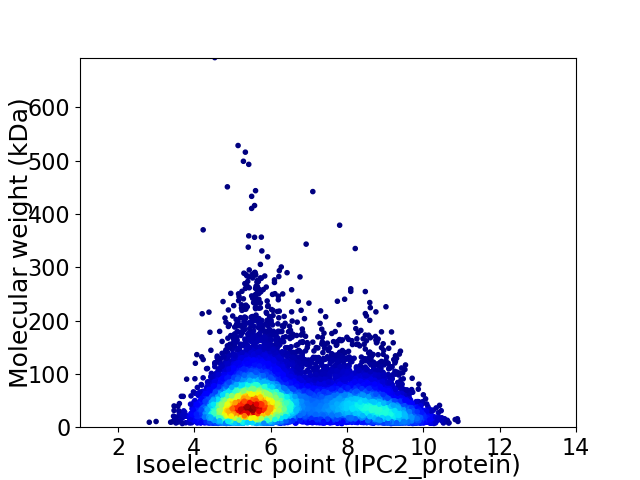
Average proteome isoelectric point is 6.46
Get precalculated fractions of proteins

Virtual 2D-PAGE plot for 12533 proteins (isoelectric point calculated using IPC2_protein)
Get csv file with sequences according to given criteria:
* You can choose from 21 different methods for calculating isoelectric point
Summary statistics related to proteome-wise predictions


Protein with the lowest isoelectric point:
>tr|A0A4Q4YVH5|A0A4Q4YVH5_9PEZI NACHT domain-containing protein OS=Monosporascus sp. 5C6A OX=2211642 GN=DL771_000030 PE=4 SV=1
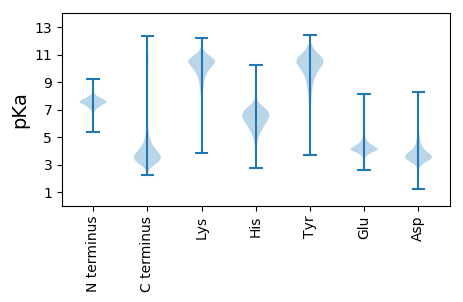
MM1 pKa = 7.69EE2 pKa = 5.59GGGPAIEE9 pKa = 4.89GVDD12 pKa = 3.8SQRR15 pKa = 11.84DD16 pKa = 3.79PTPLVHH22 pKa = 7.38NDD24 pKa = 2.12IHH26 pKa = 5.79TQNVMIGPCVANPEE40 pKa = 4.23DD41 pKa = 4.04TEE43 pKa = 5.08HH44 pKa = 6.94YY45 pKa = 7.48ITPILKK51 pKa = 10.58LIDD54 pKa = 4.21FGSGGQDD61 pKa = 3.21LEE63 pKa = 5.8GDD65 pKa = 3.87DD66 pKa = 5.41GYY68 pKa = 11.69EE69 pKa = 4.05DD70 pKa = 3.63MQSNAIIDD78 pKa = 3.61NLQNIGYY85 pKa = 9.08IINALAVLNYY95 pKa = 10.22EE96 pKa = 4.66LDD98 pKa = 3.36ATTADD103 pKa = 4.01LVTEE107 pKa = 4.84PGHH110 pKa = 5.99PGIRR114 pKa = 11.84THH116 pKa = 6.98AAEE119 pKa = 5.23LLPDD123 pKa = 3.77SNGNDD128 pKa = 3.63PCPDD132 pKa = 3.61LDD134 pKa = 3.61EE135 pKa = 4.94SLRR138 pKa = 11.84TMICLCRR145 pKa = 11.84AVQPSNVPQIGALANMIMEE164 pKa = 5.71HH165 pKa = 5.29IQEE168 pKa = 4.79RR169 pKa = 11.84DD170 pKa = 3.48EE171 pKa = 3.89EE172 pKa = 4.91WYY174 pKa = 10.71GDD176 pKa = 3.69EE177 pKa = 4.59YY178 pKa = 11.32EE179 pKa = 4.61SDD181 pKa = 3.61EE182 pKa = 4.41QIAALFQTLLFDD194 pKa = 5.14ANASS198 pKa = 3.58
MM1 pKa = 7.69EE2 pKa = 5.59GGGPAIEE9 pKa = 4.89GVDD12 pKa = 3.8SQRR15 pKa = 11.84DD16 pKa = 3.79PTPLVHH22 pKa = 7.38NDD24 pKa = 2.12IHH26 pKa = 5.79TQNVMIGPCVANPEE40 pKa = 4.23DD41 pKa = 4.04TEE43 pKa = 5.08HH44 pKa = 6.94YY45 pKa = 7.48ITPILKK51 pKa = 10.58LIDD54 pKa = 4.21FGSGGQDD61 pKa = 3.21LEE63 pKa = 5.8GDD65 pKa = 3.87DD66 pKa = 5.41GYY68 pKa = 11.69EE69 pKa = 4.05DD70 pKa = 3.63MQSNAIIDD78 pKa = 3.61NLQNIGYY85 pKa = 9.08IINALAVLNYY95 pKa = 10.22EE96 pKa = 4.66LDD98 pKa = 3.36ATTADD103 pKa = 4.01LVTEE107 pKa = 4.84PGHH110 pKa = 5.99PGIRR114 pKa = 11.84THH116 pKa = 6.98AAEE119 pKa = 5.23LLPDD123 pKa = 3.77SNGNDD128 pKa = 3.63PCPDD132 pKa = 3.61LDD134 pKa = 3.61EE135 pKa = 4.94SLRR138 pKa = 11.84TMICLCRR145 pKa = 11.84AVQPSNVPQIGALANMIMEE164 pKa = 5.71HH165 pKa = 5.29IQEE168 pKa = 4.79RR169 pKa = 11.84DD170 pKa = 3.48EE171 pKa = 3.89EE172 pKa = 4.91WYY174 pKa = 10.71GDD176 pKa = 3.69EE177 pKa = 4.59YY178 pKa = 11.32EE179 pKa = 4.61SDD181 pKa = 3.61EE182 pKa = 4.41QIAALFQTLLFDD194 pKa = 5.14ANASS198 pKa = 3.58
Molecular weight: 21.59 kDa
Isoelectric point according different methods:
Protein with the highest isoelectric point:
>tr|A0A4Q4Y458|A0A4Q4Y458_9PEZI Glycogen [starch] synthase OS=Monosporascus sp. 5C6A OX=2211642 GN=DL771_006853 PE=3 SV=1
MM1 pKa = 7.93RR2 pKa = 11.84SFSLAASAVRR12 pKa = 11.84TALSGPQSRR21 pKa = 11.84STIITTASKK30 pKa = 9.62RR31 pKa = 11.84TFSSLPQLRR40 pKa = 11.84PSILPLAHH48 pKa = 5.38GTVFRR53 pKa = 11.84PANKK57 pKa = 9.65ALSRR61 pKa = 11.84VSLTPSAPAGATGPVAMDD79 pKa = 4.43LVPKK83 pKa = 9.29TAITAHH89 pKa = 6.9PALASVQIRR98 pKa = 11.84CGPRR102 pKa = 11.84PTMARR107 pKa = 11.84SSRR110 pKa = 11.84LIRR113 pKa = 11.84KK114 pKa = 8.73RR115 pKa = 11.84RR116 pKa = 11.84HH117 pKa = 5.22GFLSRR122 pKa = 11.84LRR124 pKa = 11.84TRR126 pKa = 11.84NGRR129 pKa = 11.84RR130 pKa = 11.84TLQRR134 pKa = 11.84RR135 pKa = 11.84KK136 pKa = 9.97DD137 pKa = 3.42KK138 pKa = 10.75KK139 pKa = 10.63RR140 pKa = 11.84SVLSMM145 pKa = 4.25
MM1 pKa = 7.93RR2 pKa = 11.84SFSLAASAVRR12 pKa = 11.84TALSGPQSRR21 pKa = 11.84STIITTASKK30 pKa = 9.62RR31 pKa = 11.84TFSSLPQLRR40 pKa = 11.84PSILPLAHH48 pKa = 5.38GTVFRR53 pKa = 11.84PANKK57 pKa = 9.65ALSRR61 pKa = 11.84VSLTPSAPAGATGPVAMDD79 pKa = 4.43LVPKK83 pKa = 9.29TAITAHH89 pKa = 6.9PALASVQIRR98 pKa = 11.84CGPRR102 pKa = 11.84PTMARR107 pKa = 11.84SSRR110 pKa = 11.84LIRR113 pKa = 11.84KK114 pKa = 8.73RR115 pKa = 11.84RR116 pKa = 11.84HH117 pKa = 5.22GFLSRR122 pKa = 11.84LRR124 pKa = 11.84TRR126 pKa = 11.84NGRR129 pKa = 11.84RR130 pKa = 11.84TLQRR134 pKa = 11.84RR135 pKa = 11.84KK136 pKa = 9.97DD137 pKa = 3.42KK138 pKa = 10.75KK139 pKa = 10.63RR140 pKa = 11.84SVLSMM145 pKa = 4.25
Molecular weight: 15.76 kDa
Isoelectric point according different methods:
Peptides (in silico digests for buttom-up proteomics)
Below you can find in silico digests of the whole proteome with Trypsin, Chymotrypsin, Trypsin+LysC, LysN, ArgC proteases suitable for different mass spec machines.| Try ESI |
 |
|---|
| ChTry ESI |
 |
|---|
| ArgC ESI |
 |
|---|
| LysN ESI |
 |
|---|
| TryLysC ESI |
 |
|---|
| Try MALDI |
 |
|---|
| ChTry MALDI |
 |
|---|
| ArgC MALDI |
 |
|---|
| LysN MALDI |
 |
|---|
| TryLysC MALDI |
 |
|---|
| Try LTQ |
 |
|---|
| ChTry LTQ |
 |
|---|
| ArgC LTQ |
 |
|---|
| LysN LTQ |
 |
|---|
| TryLysC LTQ |
 |
|---|
| Try MSlow |
 |
|---|
| ChTry MSlow |
 |
|---|
| ArgC MSlow |
 |
|---|
| LysN MSlow |
 |
|---|
| TryLysC MSlow |
 |
|---|
| Try MShigh |
 |
|---|
| ChTry MShigh |
 |
|---|
| ArgC MShigh |
 |
|---|
| LysN MShigh |
 |
|---|
| TryLysC MShigh |
 |
|---|
General Statistics
Number of major isoforms |
Number of additional isoforms |
Number of all proteins |
Number of amino acids |
Min. Seq. Length |
Max. Seq. Length |
Avg. Seq. Length |
Avg. Mol. Weight |
|---|---|---|---|---|---|---|---|
0 |
6089802 |
66 |
6400 |
485.9 |
53.54 |
Amino acid frequency
Ala |
Cys |
Asp |
Glu |
Phe |
Gly |
His |
Ile |
Lys |
Leu |
|---|---|---|---|---|---|---|---|---|---|
9.5 ± 0.024 | 1.158 ± 0.008 |
5.875 ± 0.015 | 6.26 ± 0.023 |
3.516 ± 0.013 | 7.377 ± 0.022 |
2.345 ± 0.009 | 4.482 ± 0.015 |
4.49 ± 0.018 | 8.864 ± 0.026 |
Met |
Asn |
Gln |
Pro |
Arg |
Ser |
Thr |
Val |
Trp |
Tyr |
|---|---|---|---|---|---|---|---|---|---|
2.112 ± 0.008 | 3.454 ± 0.012 |
6.148 ± 0.024 | 3.873 ± 0.013 |
6.665 ± 0.021 | 7.69 ± 0.021 |
5.742 ± 0.017 | 6.306 ± 0.017 |
1.465 ± 0.009 | 2.677 ± 0.011 |
Most of the basic statistics you can see at this page can be downloaded from this CSV file
Proteome-pI is available under Creative Commons Attribution-NoDerivs license, for more details see here
| Reference: Kozlowski LP. Proteome-pI 2.0: Proteome Isoelectric Point Database Update. Nucleic Acids Res. 2021, doi: 10.1093/nar/gkab944 | Contact: Lukasz P. Kozlowski |
