Flavobacterium cerinum
Taxonomy: cellular organisms; Bacteria; FCB group; Bacteroidetes/Chlorobi group; Bacteroidetes; Flavobacteriia; Flavobacteriales; Flavobacteriaceae; Flavobacterium
Average proteome isoelectric point is 6.53
Get precalculated fractions of proteins

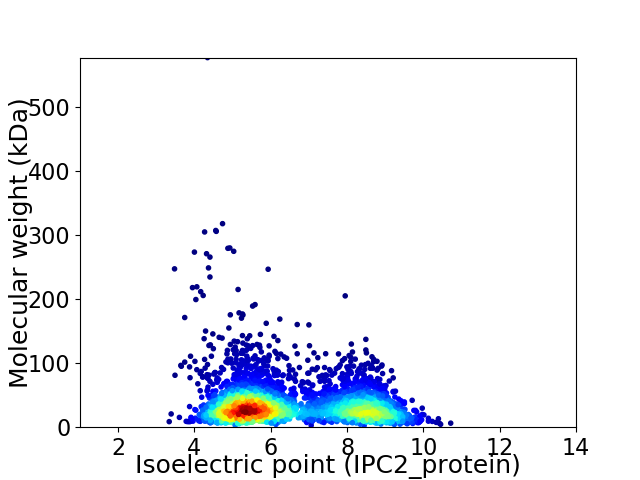
Virtual 2D-PAGE plot for 3673 proteins (isoelectric point calculated using IPC2_protein)
Get csv file with sequences according to given criteria:
* You can choose from 21 different methods for calculating isoelectric point
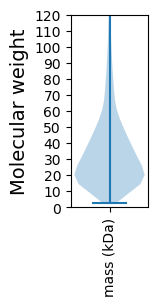
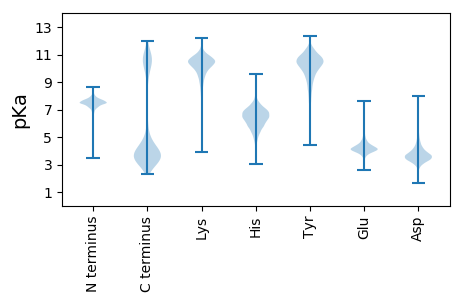
Summary statistics related to proteome-wise predictions


Protein with the lowest isoelectric point:
>tr|A0A3S3QFA5|A0A3S3QFA5_9FLAO Uncharacterized protein OS=Flavobacterium cerinum OX=2502784 GN=EPI11_16575 PE=4 SV=1
MM1 pKa = 7.47KK2 pKa = 10.06KK3 pKa = 9.77IKK5 pKa = 10.38LILVSLFTVAMMLSCDD21 pKa = 4.72DD22 pKa = 4.93DD23 pKa = 6.67GGDD26 pKa = 3.44SKK28 pKa = 11.65INLEE32 pKa = 4.17VGAVPNIVKK41 pKa = 10.39SEE43 pKa = 3.95TDD45 pKa = 3.61DD46 pKa = 5.84LILNLVKK53 pKa = 10.49IQDD56 pKa = 4.07GEE58 pKa = 4.31NITIGFSIEE67 pKa = 3.8MAQGKK72 pKa = 9.54ISSLDD77 pKa = 3.32LVAFYY82 pKa = 10.76IKK84 pKa = 10.74GDD86 pKa = 3.42GSAEE90 pKa = 4.12KK91 pKa = 10.19IVLASNVTTFPTSMTLTKK109 pKa = 10.34QQLIDD114 pKa = 3.73KK115 pKa = 7.35FTVLTDD121 pKa = 3.48DD122 pKa = 3.93TDD124 pKa = 4.13FEE126 pKa = 5.77LGDD129 pKa = 4.03EE130 pKa = 4.91LIITADD136 pKa = 3.35LTLANGTLLKK146 pKa = 10.54LHH148 pKa = 6.9NDD150 pKa = 4.32DD151 pKa = 4.82GSQNYY156 pKa = 8.51GQDD159 pKa = 3.04IANSPIYY166 pKa = 10.56SVAQSYY172 pKa = 9.87LVACPSDD179 pKa = 3.41LAGTYY184 pKa = 10.46SVITSGEE191 pKa = 4.2STDD194 pKa = 4.58AGPTPDD200 pKa = 4.43EE201 pKa = 4.53NPITDD206 pKa = 3.77YY207 pKa = 11.07PFTVTLTDD215 pKa = 3.52KK216 pKa = 11.26GAGSYY221 pKa = 10.52EE222 pKa = 3.83MSDD225 pKa = 3.38AYY227 pKa = 10.63GGLYY231 pKa = 9.9LLWYY235 pKa = 9.76DD236 pKa = 4.19MYY238 pKa = 11.3GITPDD243 pKa = 3.94HH244 pKa = 7.09SIATIKK250 pKa = 10.38DD251 pKa = 3.34VCGVLSASYY260 pKa = 9.86KK261 pKa = 10.58GPFTEE266 pKa = 5.02SVTLSGMVNDD276 pKa = 5.32DD277 pKa = 3.64GTLTIHH283 pKa = 6.97WEE285 pKa = 3.88NEE287 pKa = 3.77YY288 pKa = 11.3GDD290 pKa = 4.8FGDD293 pKa = 5.56SVYY296 pKa = 11.02TKK298 pKa = 10.84NN299 pKa = 4.16
MM1 pKa = 7.47KK2 pKa = 10.06KK3 pKa = 9.77IKK5 pKa = 10.38LILVSLFTVAMMLSCDD21 pKa = 4.72DD22 pKa = 4.93DD23 pKa = 6.67GGDD26 pKa = 3.44SKK28 pKa = 11.65INLEE32 pKa = 4.17VGAVPNIVKK41 pKa = 10.39SEE43 pKa = 3.95TDD45 pKa = 3.61DD46 pKa = 5.84LILNLVKK53 pKa = 10.49IQDD56 pKa = 4.07GEE58 pKa = 4.31NITIGFSIEE67 pKa = 3.8MAQGKK72 pKa = 9.54ISSLDD77 pKa = 3.32LVAFYY82 pKa = 10.76IKK84 pKa = 10.74GDD86 pKa = 3.42GSAEE90 pKa = 4.12KK91 pKa = 10.19IVLASNVTTFPTSMTLTKK109 pKa = 10.34QQLIDD114 pKa = 3.73KK115 pKa = 7.35FTVLTDD121 pKa = 3.48DD122 pKa = 3.93TDD124 pKa = 4.13FEE126 pKa = 5.77LGDD129 pKa = 4.03EE130 pKa = 4.91LIITADD136 pKa = 3.35LTLANGTLLKK146 pKa = 10.54LHH148 pKa = 6.9NDD150 pKa = 4.32DD151 pKa = 4.82GSQNYY156 pKa = 8.51GQDD159 pKa = 3.04IANSPIYY166 pKa = 10.56SVAQSYY172 pKa = 9.87LVACPSDD179 pKa = 3.41LAGTYY184 pKa = 10.46SVITSGEE191 pKa = 4.2STDD194 pKa = 4.58AGPTPDD200 pKa = 4.43EE201 pKa = 4.53NPITDD206 pKa = 3.77YY207 pKa = 11.07PFTVTLTDD215 pKa = 3.52KK216 pKa = 11.26GAGSYY221 pKa = 10.52EE222 pKa = 3.83MSDD225 pKa = 3.38AYY227 pKa = 10.63GGLYY231 pKa = 9.9LLWYY235 pKa = 9.76DD236 pKa = 4.19MYY238 pKa = 11.3GITPDD243 pKa = 3.94HH244 pKa = 7.09SIATIKK250 pKa = 10.38DD251 pKa = 3.34VCGVLSASYY260 pKa = 9.86KK261 pKa = 10.58GPFTEE266 pKa = 5.02SVTLSGMVNDD276 pKa = 5.32DD277 pKa = 3.64GTLTIHH283 pKa = 6.97WEE285 pKa = 3.88NEE287 pKa = 3.77YY288 pKa = 11.3GDD290 pKa = 4.8FGDD293 pKa = 5.56SVYY296 pKa = 11.02TKK298 pKa = 10.84NN299 pKa = 4.16
Molecular weight: 32.19 kDa
Isoelectric point according different methods:
Protein with the highest isoelectric point:
>tr|A0A3S3U465|A0A3S3U465_9FLAO DUF4256 domain-containing protein OS=Flavobacterium cerinum OX=2502784 GN=EPI11_03155 PE=4 SV=1
MM1 pKa = 7.69SKK3 pKa = 9.01RR4 pKa = 11.84TFQPSKK10 pKa = 9.13RR11 pKa = 11.84KK12 pKa = 9.48RR13 pKa = 11.84RR14 pKa = 11.84NKK16 pKa = 9.91HH17 pKa = 4.39GFMDD21 pKa = 4.5RR22 pKa = 11.84MASANGRR29 pKa = 11.84KK30 pKa = 9.04VLARR34 pKa = 11.84RR35 pKa = 11.84RR36 pKa = 11.84AKK38 pKa = 10.19GRR40 pKa = 11.84HH41 pKa = 5.41KK42 pKa = 10.14LTVSSEE48 pKa = 3.92PRR50 pKa = 11.84HH51 pKa = 5.77KK52 pKa = 10.61KK53 pKa = 9.84
MM1 pKa = 7.69SKK3 pKa = 9.01RR4 pKa = 11.84TFQPSKK10 pKa = 9.13RR11 pKa = 11.84KK12 pKa = 9.48RR13 pKa = 11.84RR14 pKa = 11.84NKK16 pKa = 9.91HH17 pKa = 4.39GFMDD21 pKa = 4.5RR22 pKa = 11.84MASANGRR29 pKa = 11.84KK30 pKa = 9.04VLARR34 pKa = 11.84RR35 pKa = 11.84RR36 pKa = 11.84AKK38 pKa = 10.19GRR40 pKa = 11.84HH41 pKa = 5.41KK42 pKa = 10.14LTVSSEE48 pKa = 3.92PRR50 pKa = 11.84HH51 pKa = 5.77KK52 pKa = 10.61KK53 pKa = 9.84
Molecular weight: 6.3 kDa
Isoelectric point according different methods:
Peptides (in silico digests for buttom-up proteomics)
Below you can find in silico digests of the whole proteome with Trypsin, Chymotrypsin, Trypsin+LysC, LysN, ArgC proteases suitable for different mass spec machines.| Try ESI |
 |
|---|
| ChTry ESI |
 |
|---|
| ArgC ESI |
 |
|---|
| LysN ESI |
 |
|---|
| TryLysC ESI |
 |
|---|
| Try MALDI |
 |
|---|
| ChTry MALDI |
 |
|---|
| ArgC MALDI |
 |
|---|
| LysN MALDI |
 |
|---|
| TryLysC MALDI |
 |
|---|
| Try LTQ |
 |
|---|
| ChTry LTQ |
 |
|---|
| ArgC LTQ |
 |
|---|
| LysN LTQ |
 |
|---|
| TryLysC LTQ |
 |
|---|
| Try MSlow |
 |
|---|
| ChTry MSlow |
 |
|---|
| ArgC MSlow |
 |
|---|
| LysN MSlow |
 |
|---|
| TryLysC MSlow |
 |
|---|
| Try MShigh |
 |
|---|
| ChTry MShigh |
 |
|---|
| ArgC MShigh |
 |
|---|
| LysN MShigh |
 |
|---|
| TryLysC MShigh |
 |
|---|
General Statistics
Number of major isoforms |
Number of additional isoforms |
Number of all proteins |
Number of amino acids |
Min. Seq. Length |
Max. Seq. Length |
Avg. Seq. Length |
Avg. Mol. Weight |
|---|---|---|---|---|---|---|---|
0 |
1213498 |
24 |
5527 |
330.4 |
37.02 |
Amino acid frequency
Ala |
Cys |
Asp |
Glu |
Phe |
Gly |
His |
Ile |
Lys |
Leu |
|---|---|---|---|---|---|---|---|---|---|
7.002 ± 0.054 | 0.818 ± 0.018 |
5.397 ± 0.033 | 6.164 ± 0.056 |
5.026 ± 0.033 | 6.636 ± 0.047 |
1.662 ± 0.023 | 7.815 ± 0.043 |
7.556 ± 0.076 | 8.967 ± 0.046 |
Met |
Asn |
Gln |
Pro |
Arg |
Ser |
Thr |
Val |
Trp |
Tyr |
|---|---|---|---|---|---|---|---|---|---|
2.305 ± 0.025 | 6.071 ± 0.047 |
3.573 ± 0.033 | 3.317 ± 0.022 |
3.227 ± 0.031 | 6.332 ± 0.042 |
6.527 ± 0.1 | 6.444 ± 0.037 |
1.016 ± 0.015 | 4.145 ± 0.031 |
Most of the basic statistics you can see at this page can be downloaded from this CSV file
Proteome-pI is available under Creative Commons Attribution-NoDerivs license, for more details see here
| Reference: Kozlowski LP. Proteome-pI 2.0: Proteome Isoelectric Point Database Update. Nucleic Acids Res. 2021, doi: 10.1093/nar/gkab944 | Contact: Lukasz P. Kozlowski |
