Allium virus X
Taxonomy: Viruses; Riboviria; Orthornavirae; Kitrinoviricota; Alsuviricetes; Tymovirales; Alphaflexiviridae; Potexvirus
Average proteome isoelectric point is 7.02
Get precalculated fractions of proteins

Virtual 2D-PAGE plot for 5 proteins (isoelectric point calculated using IPC2_protein)
Get csv file with sequences according to given criteria:
* You can choose from 21 different methods for calculating isoelectric point
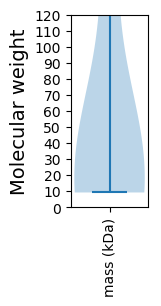
Summary statistics related to proteome-wise predictions


Protein with the lowest isoelectric point:
>tr|C0L9E3|C0L9E3_9VIRU Tgb2 OS=Allium virus X OX=317027 PE=4 SV=1
MM1 pKa = 6.83NTLVDD6 pKa = 3.93TLVEE10 pKa = 4.03AGFIRR15 pKa = 11.84THH17 pKa = 6.4EE18 pKa = 4.37PLSNPLVVHH27 pKa = 6.45AVAGAGKK34 pKa = 10.02SSLIRR39 pKa = 11.84RR40 pKa = 11.84LLEE43 pKa = 3.58TDD45 pKa = 2.75ATFRR49 pKa = 11.84AFTRR53 pKa = 11.84GPPDD57 pKa = 4.25PPSLDD62 pKa = 3.08ATAIQAFQPNPPSHH76 pKa = 7.03LFNILDD82 pKa = 4.06EE83 pKa = 4.54YY84 pKa = 10.53PAGEE88 pKa = 4.58VKK90 pKa = 10.82GPWAALFADD99 pKa = 4.81PLQHH103 pKa = 6.62RR104 pKa = 11.84AHH106 pKa = 7.18PRR108 pKa = 11.84RR109 pKa = 11.84PHH111 pKa = 5.97FIKK114 pKa = 10.47RR115 pKa = 11.84CSHH118 pKa = 6.45RR119 pKa = 11.84LSASTAALLTSLGIPITGTGQGNFTSAHH147 pKa = 5.57GVFEE151 pKa = 4.59GPLIGKK157 pKa = 9.52IISLDD162 pKa = 3.43NHH164 pKa = 6.32ISLLLSNHH172 pKa = 5.55SVPYY176 pKa = 8.87ATPDD180 pKa = 3.36DD181 pKa = 3.9VLGQEE186 pKa = 4.51FPITTVISALPLHH199 pKa = 6.47AVCDD203 pKa = 4.02KK204 pKa = 10.6VGLYY208 pKa = 9.8IALSRR213 pKa = 11.84HH214 pKa = 4.35TSEE217 pKa = 5.54LHH219 pKa = 5.31VLCPNPPHH227 pKa = 6.82PTTT230 pKa = 4.01
MM1 pKa = 6.83NTLVDD6 pKa = 3.93TLVEE10 pKa = 4.03AGFIRR15 pKa = 11.84THH17 pKa = 6.4EE18 pKa = 4.37PLSNPLVVHH27 pKa = 6.45AVAGAGKK34 pKa = 10.02SSLIRR39 pKa = 11.84RR40 pKa = 11.84LLEE43 pKa = 3.58TDD45 pKa = 2.75ATFRR49 pKa = 11.84AFTRR53 pKa = 11.84GPPDD57 pKa = 4.25PPSLDD62 pKa = 3.08ATAIQAFQPNPPSHH76 pKa = 7.03LFNILDD82 pKa = 4.06EE83 pKa = 4.54YY84 pKa = 10.53PAGEE88 pKa = 4.58VKK90 pKa = 10.82GPWAALFADD99 pKa = 4.81PLQHH103 pKa = 6.62RR104 pKa = 11.84AHH106 pKa = 7.18PRR108 pKa = 11.84RR109 pKa = 11.84PHH111 pKa = 5.97FIKK114 pKa = 10.47RR115 pKa = 11.84CSHH118 pKa = 6.45RR119 pKa = 11.84LSASTAALLTSLGIPITGTGQGNFTSAHH147 pKa = 5.57GVFEE151 pKa = 4.59GPLIGKK157 pKa = 9.52IISLDD162 pKa = 3.43NHH164 pKa = 6.32ISLLLSNHH172 pKa = 5.55SVPYY176 pKa = 8.87ATPDD180 pKa = 3.36DD181 pKa = 3.9VLGQEE186 pKa = 4.51FPITTVISALPLHH199 pKa = 6.47AVCDD203 pKa = 4.02KK204 pKa = 10.6VGLYY208 pKa = 9.8IALSRR213 pKa = 11.84HH214 pKa = 4.35TSEE217 pKa = 5.54LHH219 pKa = 5.31VLCPNPPHH227 pKa = 6.82PTTT230 pKa = 4.01
Molecular weight: 24.71 kDa
Isoelectric point according different methods:
Protein with the highest isoelectric point:
>tr|C0L9E4|C0L9E4_9VIRU Movement protein TGBp3 OS=Allium virus X OX=317027 PE=3 SV=1
MM1 pKa = 7.42SSAPIHH7 pKa = 5.85LTPPPDD13 pKa = 3.29HH14 pKa = 7.08SKK16 pKa = 10.46VFISVVVGVSIALCVFLLNKK36 pKa = 10.32NYY38 pKa = 10.27LPHH41 pKa = 8.18VGDD44 pKa = 4.23NLHH47 pKa = 6.43SLPHH51 pKa = 6.52GGTYY55 pKa = 10.35CDD57 pKa = 3.47GTKK60 pKa = 10.3SINYY64 pKa = 8.48RR65 pKa = 11.84GPSHH69 pKa = 6.34HH70 pKa = 7.04TSSTTPLWAVIATLTLPLAIFLLNARR96 pKa = 11.84RR97 pKa = 11.84TSHH100 pKa = 6.98HH101 pKa = 5.23STLRR105 pKa = 11.84CGHH108 pKa = 7.07AACASGLDD116 pKa = 3.76STNPP120 pKa = 3.38
MM1 pKa = 7.42SSAPIHH7 pKa = 5.85LTPPPDD13 pKa = 3.29HH14 pKa = 7.08SKK16 pKa = 10.46VFISVVVGVSIALCVFLLNKK36 pKa = 10.32NYY38 pKa = 10.27LPHH41 pKa = 8.18VGDD44 pKa = 4.23NLHH47 pKa = 6.43SLPHH51 pKa = 6.52GGTYY55 pKa = 10.35CDD57 pKa = 3.47GTKK60 pKa = 10.3SINYY64 pKa = 8.48RR65 pKa = 11.84GPSHH69 pKa = 6.34HH70 pKa = 7.04TSSTTPLWAVIATLTLPLAIFLLNARR96 pKa = 11.84RR97 pKa = 11.84TSHH100 pKa = 6.98HH101 pKa = 5.23STLRR105 pKa = 11.84CGHH108 pKa = 7.07AACASGLDD116 pKa = 3.76STNPP120 pKa = 3.38
Molecular weight: 12.77 kDa
Isoelectric point according different methods:
Peptides (in silico digests for buttom-up proteomics)
Below you can find in silico digests of the whole proteome with Trypsin, Chymotrypsin, Trypsin+LysC, LysN, ArgC proteases suitable for different mass spec machines.| Try ESI |
 |
|---|
| ChTry ESI |
 |
|---|
| ArgC ESI |
 |
|---|
| LysN ESI |
 |
|---|
| TryLysC ESI |
 |
|---|
| Try MALDI |
 |
|---|
| ChTry MALDI |
 |
|---|
| ArgC MALDI |
 |
|---|
| LysN MALDI |
 |
|---|
| TryLysC MALDI |
 |
|---|
| Try LTQ |
 |
|---|
| ChTry LTQ |
 |
|---|
| ArgC LTQ |
 |
|---|
| LysN LTQ |
 |
|---|
| TryLysC LTQ |
 |
|---|
| Try MSlow |
 |
|---|
| ChTry MSlow |
 |
|---|
| ArgC MSlow |
 |
|---|
| LysN MSlow |
 |
|---|
| TryLysC MSlow |
 |
|---|
| Try MShigh |
 |
|---|
| ChTry MShigh |
 |
|---|
| ArgC MShigh |
 |
|---|
| LysN MShigh |
 |
|---|
| TryLysC MShigh |
 |
|---|
General Statistics
Number of major isoforms |
Number of additional isoforms |
Number of all proteins |
Number of amino acids |
Min. Seq. Length |
Max. Seq. Length |
Avg. Seq. Length |
Avg. Mol. Weight |
|---|---|---|---|---|---|---|---|
0 |
2359 |
83 |
1701 |
471.8 |
52.75 |
Amino acid frequency
Ala |
Cys |
Asp |
Glu |
Phe |
Gly |
His |
Ile |
Lys |
Leu |
|---|---|---|---|---|---|---|---|---|---|
8.351 ± 0.688 | 1.78 ± 0.454 |
4.621 ± 0.6 | 5.087 ± 1.187 |
4.833 ± 0.681 | 4.833 ± 0.522 |
4.451 ± 0.927 | 4.663 ± 0.435 |
5.256 ± 1.068 | 10.725 ± 0.641 |
Met |
Asn |
Gln |
Pro |
Arg |
Ser |
Thr |
Val |
Trp |
Tyr |
|---|---|---|---|---|---|---|---|---|---|
1.865 ± 0.423 | 4.154 ± 0.293 |
7.164 ± 1.107 | 4.621 ± 0.907 |
4.409 ± 0.53 | 6.825 ± 0.694 |
7.885 ± 1.028 | 4.663 ± 0.717 |
1.145 ± 0.179 | 2.671 ± 0.435 |
Most of the basic statistics you can see at this page can be downloaded from this CSV file
Proteome-pI is available under Creative Commons Attribution-NoDerivs license, for more details see here
| Reference: Kozlowski LP. Proteome-pI 2.0: Proteome Isoelectric Point Database Update. Nucleic Acids Res. 2021, doi: 10.1093/nar/gkab944 | Contact: Lukasz P. Kozlowski |
