Geosporobacter subterraneus DSM 17957
Taxonomy: cellular organisms; Bacteria; Terrabacteria group; Firmicutes; Clostridia; Eubacteriales; Clostridiaceae; Geosporobacter; Geosporobacter subterraneus
Average proteome isoelectric point is 6.44
Get precalculated fractions of proteins

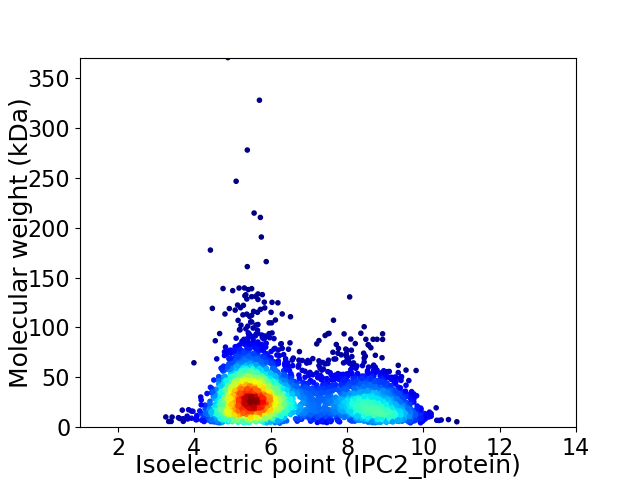
Virtual 2D-PAGE plot for 3760 proteins (isoelectric point calculated using IPC2_protein)
Get csv file with sequences according to given criteria:
* You can choose from 21 different methods for calculating isoelectric point
Summary statistics related to proteome-wise predictions


Protein with the lowest isoelectric point:
>tr|A0A1M6QJ98|A0A1M6QJ98_9CLOT Dihydroxyacetone kinase DhaL subunit OS=Geosporobacter subterraneus DSM 17957 OX=1121919 GN=SAMN02745975_03860 PE=4 SV=1
MM1 pKa = 7.44KK2 pKa = 10.38GVTIFGNFTVLEE14 pKa = 4.16TFMFNDD20 pKa = 3.8LQIDD24 pKa = 3.44KK25 pKa = 11.07GFDD28 pKa = 3.03EE29 pKa = 5.26RR30 pKa = 11.84LDD32 pKa = 3.0IFYY35 pKa = 10.65RR36 pKa = 11.84VNLYY40 pKa = 9.96IEE42 pKa = 4.36NLEE45 pKa = 4.69DD46 pKa = 5.93DD47 pKa = 4.3INDD50 pKa = 3.89TFIDD54 pKa = 4.11CYY56 pKa = 10.67YY57 pKa = 10.93RR58 pKa = 11.84SINDD62 pKa = 3.21LMEE65 pKa = 5.67DD66 pKa = 3.75IKK68 pKa = 11.08CYY70 pKa = 10.66SINQTT75 pKa = 3.41
MM1 pKa = 7.44KK2 pKa = 10.38GVTIFGNFTVLEE14 pKa = 4.16TFMFNDD20 pKa = 3.8LQIDD24 pKa = 3.44KK25 pKa = 11.07GFDD28 pKa = 3.03EE29 pKa = 5.26RR30 pKa = 11.84LDD32 pKa = 3.0IFYY35 pKa = 10.65RR36 pKa = 11.84VNLYY40 pKa = 9.96IEE42 pKa = 4.36NLEE45 pKa = 4.69DD46 pKa = 5.93DD47 pKa = 4.3INDD50 pKa = 3.89TFIDD54 pKa = 4.11CYY56 pKa = 10.67YY57 pKa = 10.93RR58 pKa = 11.84SINDD62 pKa = 3.21LMEE65 pKa = 5.67DD66 pKa = 3.75IKK68 pKa = 11.08CYY70 pKa = 10.66SINQTT75 pKa = 3.41
Molecular weight: 9.01 kDa
Isoelectric point according different methods:
Protein with the highest isoelectric point:
>tr|A0A1M6QKW3|A0A1M6QKW3_9CLOT Uncharacterized protein (Fragment) OS=Geosporobacter subterraneus DSM 17957 OX=1121919 GN=SAMN02745975_03868 PE=4 SV=1
MM1 pKa = 7.3NEE3 pKa = 3.56SMLWLLRR10 pKa = 11.84DD11 pKa = 3.21TGKK14 pKa = 10.76AKK16 pKa = 10.33KK17 pKa = 10.07QGMNAIKK24 pKa = 9.94EE25 pKa = 4.22RR26 pKa = 11.84QRR28 pKa = 11.84TRR30 pKa = 11.84LAEE33 pKa = 3.76IVAFARR39 pKa = 11.84GNSPYY44 pKa = 10.23YY45 pKa = 10.2RR46 pKa = 11.84EE47 pKa = 4.42LYY49 pKa = 10.07KK50 pKa = 10.67DD51 pKa = 3.39LPEE54 pKa = 6.19RR55 pKa = 11.84IEE57 pKa = 4.36DD58 pKa = 3.84TTLLPITSKK67 pKa = 10.15MKK69 pKa = 10.62LMPRR73 pKa = 11.84FNDD76 pKa = 2.69WCTDD80 pKa = 3.33RR81 pKa = 11.84NVTFDD86 pKa = 3.43KK87 pKa = 11.21VSAFVDD93 pKa = 3.58NPDD96 pKa = 4.32LIGKK100 pKa = 9.48RR101 pKa = 11.84FLEE104 pKa = 4.86KK105 pKa = 10.3YY106 pKa = 9.13TITTTSGITRR116 pKa = 11.84TRR118 pKa = 11.84GIFLLNDD125 pKa = 3.32RR126 pKa = 11.84SLAVASSIAFRR137 pKa = 11.84MMSSWIGKK145 pKa = 7.47WDD147 pKa = 3.55VVRR150 pKa = 11.84IIPKK154 pKa = 9.43PVTAMPPPRR163 pKa = 11.84LLTTILIHH171 pKa = 6.63GARR174 pKa = 11.84QQRR177 pKa = 11.84LARR180 pKa = 11.84AGSCRR185 pKa = 11.84RR186 pKa = 11.84QLPTMAPGEE195 pKa = 4.11WSHH198 pKa = 5.99TVLVATSPTGYY209 pKa = 8.66SQSYY213 pKa = 7.12ATTWAIVSCCGLPLARR229 pKa = 11.84VPGINIIQILQTTPTNLRR247 pKa = 11.84VRR249 pKa = 11.84LRR251 pKa = 11.84PATGAAA257 pKa = 3.55
MM1 pKa = 7.3NEE3 pKa = 3.56SMLWLLRR10 pKa = 11.84DD11 pKa = 3.21TGKK14 pKa = 10.76AKK16 pKa = 10.33KK17 pKa = 10.07QGMNAIKK24 pKa = 9.94EE25 pKa = 4.22RR26 pKa = 11.84QRR28 pKa = 11.84TRR30 pKa = 11.84LAEE33 pKa = 3.76IVAFARR39 pKa = 11.84GNSPYY44 pKa = 10.23YY45 pKa = 10.2RR46 pKa = 11.84EE47 pKa = 4.42LYY49 pKa = 10.07KK50 pKa = 10.67DD51 pKa = 3.39LPEE54 pKa = 6.19RR55 pKa = 11.84IEE57 pKa = 4.36DD58 pKa = 3.84TTLLPITSKK67 pKa = 10.15MKK69 pKa = 10.62LMPRR73 pKa = 11.84FNDD76 pKa = 2.69WCTDD80 pKa = 3.33RR81 pKa = 11.84NVTFDD86 pKa = 3.43KK87 pKa = 11.21VSAFVDD93 pKa = 3.58NPDD96 pKa = 4.32LIGKK100 pKa = 9.48RR101 pKa = 11.84FLEE104 pKa = 4.86KK105 pKa = 10.3YY106 pKa = 9.13TITTTSGITRR116 pKa = 11.84TRR118 pKa = 11.84GIFLLNDD125 pKa = 3.32RR126 pKa = 11.84SLAVASSIAFRR137 pKa = 11.84MMSSWIGKK145 pKa = 7.47WDD147 pKa = 3.55VVRR150 pKa = 11.84IIPKK154 pKa = 9.43PVTAMPPPRR163 pKa = 11.84LLTTILIHH171 pKa = 6.63GARR174 pKa = 11.84QQRR177 pKa = 11.84LARR180 pKa = 11.84AGSCRR185 pKa = 11.84RR186 pKa = 11.84QLPTMAPGEE195 pKa = 4.11WSHH198 pKa = 5.99TVLVATSPTGYY209 pKa = 8.66SQSYY213 pKa = 7.12ATTWAIVSCCGLPLARR229 pKa = 11.84VPGINIIQILQTTPTNLRR247 pKa = 11.84VRR249 pKa = 11.84LRR251 pKa = 11.84PATGAAA257 pKa = 3.55
Molecular weight: 28.92 kDa
Isoelectric point according different methods:
Peptides (in silico digests for buttom-up proteomics)
Below you can find in silico digests of the whole proteome with Trypsin, Chymotrypsin, Trypsin+LysC, LysN, ArgC proteases suitable for different mass spec machines.| Try ESI |
 |
|---|
| ChTry ESI |
 |
|---|
| ArgC ESI |
 |
|---|
| LysN ESI |
 |
|---|
| TryLysC ESI |
 |
|---|
| Try MALDI |
 |
|---|
| ChTry MALDI |
 |
|---|
| ArgC MALDI |
 |
|---|
| LysN MALDI |
 |
|---|
| TryLysC MALDI |
 |
|---|
| Try LTQ |
 |
|---|
| ChTry LTQ |
 |
|---|
| ArgC LTQ |
 |
|---|
| LysN LTQ |
 |
|---|
| TryLysC LTQ |
 |
|---|
| Try MSlow |
 |
|---|
| ChTry MSlow |
 |
|---|
| ArgC MSlow |
 |
|---|
| LysN MSlow |
 |
|---|
| TryLysC MSlow |
 |
|---|
| Try MShigh |
 |
|---|
| ChTry MShigh |
 |
|---|
| ArgC MShigh |
 |
|---|
| LysN MShigh |
 |
|---|
| TryLysC MShigh |
 |
|---|
General Statistics
Number of major isoforms |
Number of additional isoforms |
Number of all proteins |
Number of amino acids |
Min. Seq. Length |
Max. Seq. Length |
Avg. Seq. Length |
Avg. Mol. Weight |
|---|---|---|---|---|---|---|---|
0 |
1097426 |
39 |
3284 |
291.9 |
32.76 |
Amino acid frequency
Ala |
Cys |
Asp |
Glu |
Phe |
Gly |
His |
Ile |
Lys |
Leu |
|---|---|---|---|---|---|---|---|---|---|
7.154 ± 0.041 | 1.03 ± 0.014 |
5.125 ± 0.028 | 7.581 ± 0.044 |
4.052 ± 0.028 | 7.105 ± 0.041 |
1.889 ± 0.019 | 8.824 ± 0.04 |
7.39 ± 0.035 | 9.543 ± 0.043 |
Met |
Asn |
Gln |
Pro |
Arg |
Ser |
Thr |
Val |
Trp |
Tyr |
|---|---|---|---|---|---|---|---|---|---|
2.98 ± 0.02 | 4.41 ± 0.028 |
3.427 ± 0.025 | 3.508 ± 0.026 |
4.405 ± 0.031 | 5.433 ± 0.031 |
4.968 ± 0.031 | 6.754 ± 0.037 |
0.764 ± 0.015 | 3.659 ± 0.028 |
Most of the basic statistics you can see at this page can be downloaded from this CSV file
Proteome-pI is available under Creative Commons Attribution-NoDerivs license, for more details see here
| Reference: Kozlowski LP. Proteome-pI 2.0: Proteome Isoelectric Point Database Update. Nucleic Acids Res. 2021, doi: 10.1093/nar/gkab944 | Contact: Lukasz P. Kozlowski |
