Vibrio phage Aphrodite1
Taxonomy: Viruses; Duplodnaviria; Heunggongvirae; Uroviricota; Caudoviricetes; Caudovirales; Myoviridae; Gorgonvirinae; Aphroditevirus; Vibrio virus Aphrodite1
Average proteome isoelectric point is 5.82
Get precalculated fractions of proteins

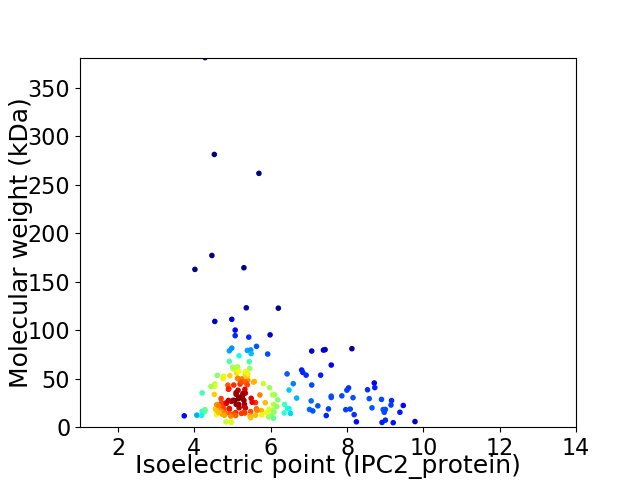
Virtual 2D-PAGE plot for 198 proteins (isoelectric point calculated using IPC2_protein)
Get csv file with sequences according to given criteria:
* You can choose from 21 different methods for calculating isoelectric point
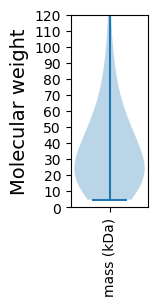
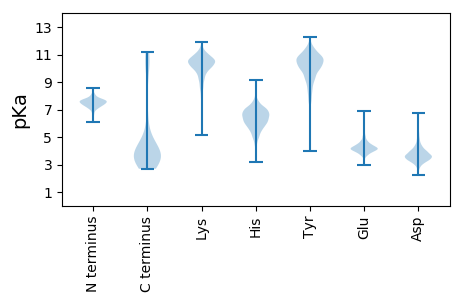
Summary statistics related to proteome-wise predictions


Protein with the lowest isoelectric point:
>tr|A0A2I7QI64|A0A2I7QI64_9CAUD Uncharacterized protein OS=Vibrio phage Aphrodite1 OX=2070057 GN=Aphrodite1_0024 PE=4 SV=1
MM1 pKa = 7.72TDD3 pKa = 3.82FTEE6 pKa = 4.24MTQAEE11 pKa = 4.53LLHH14 pKa = 6.58AFFYY18 pKa = 9.77TAYY21 pKa = 9.33EE22 pKa = 4.07NTVSFGRR29 pKa = 11.84QAAVEE34 pKa = 3.86QAIAGMFTNLLRR46 pKa = 11.84SIVIIEE52 pKa = 4.5KK53 pKa = 10.41FDD55 pKa = 3.88DD56 pKa = 4.54FPWLIIQSEE65 pKa = 4.18ITAICIQMVEE75 pKa = 4.9DD76 pKa = 4.32IDD78 pKa = 6.01DD79 pKa = 3.8ILSGNEE85 pKa = 3.74LIAYY89 pKa = 8.26NPLPNVEE96 pKa = 4.26YY97 pKa = 9.31PKK99 pKa = 11.57AMMLEE104 pKa = 4.33IVHH107 pKa = 6.2EE108 pKa = 4.5CC109 pKa = 3.87
MM1 pKa = 7.72TDD3 pKa = 3.82FTEE6 pKa = 4.24MTQAEE11 pKa = 4.53LLHH14 pKa = 6.58AFFYY18 pKa = 9.77TAYY21 pKa = 9.33EE22 pKa = 4.07NTVSFGRR29 pKa = 11.84QAAVEE34 pKa = 3.86QAIAGMFTNLLRR46 pKa = 11.84SIVIIEE52 pKa = 4.5KK53 pKa = 10.41FDD55 pKa = 3.88DD56 pKa = 4.54FPWLIIQSEE65 pKa = 4.18ITAICIQMVEE75 pKa = 4.9DD76 pKa = 4.32IDD78 pKa = 6.01DD79 pKa = 3.8ILSGNEE85 pKa = 3.74LIAYY89 pKa = 8.26NPLPNVEE96 pKa = 4.26YY97 pKa = 9.31PKK99 pKa = 11.57AMMLEE104 pKa = 4.33IVHH107 pKa = 6.2EE108 pKa = 4.5CC109 pKa = 3.87
Molecular weight: 12.46 kDa
Isoelectric point according different methods:
Protein with the highest isoelectric point:
>tr|A0A2I7QI14|A0A2I7QI14_9CAUD Uncharacterized protein OS=Vibrio phage Aphrodite1 OX=2070057 GN=Aphrodite1_0208 PE=4 SV=1
MM1 pKa = 7.74LIKK4 pKa = 10.54KK5 pKa = 9.72LLYY8 pKa = 9.57PRR10 pKa = 11.84TVDD13 pKa = 3.72GFLDD17 pKa = 3.56QLEE20 pKa = 4.53EE21 pKa = 4.22KK22 pKa = 10.95VMALSSVKK30 pKa = 9.83TNNYY34 pKa = 8.48YY35 pKa = 10.97DD36 pKa = 4.26LVFATLRR43 pKa = 11.84EE44 pKa = 4.28EE45 pKa = 4.43YY46 pKa = 9.79EE47 pKa = 3.53NWMEE51 pKa = 4.34LRR53 pKa = 11.84VFPKK57 pKa = 10.16IKK59 pKa = 9.84EE60 pKa = 3.82QRR62 pKa = 11.84QTVRR66 pKa = 11.84LVNVSIKK73 pKa = 9.46TNNRR77 pKa = 11.84NRR79 pKa = 11.84EE80 pKa = 3.9RR81 pKa = 11.84LFFRR85 pKa = 11.84LPVVVGSRR93 pKa = 11.84MDD95 pKa = 3.23KK96 pKa = 10.86KK97 pKa = 10.47EE98 pKa = 4.02CSKK101 pKa = 11.03KK102 pKa = 9.64NHH104 pKa = 6.16FCRR107 pKa = 11.84GYY109 pKa = 11.12DD110 pKa = 3.51EE111 pKa = 5.16TDD113 pKa = 3.12LDD115 pKa = 4.64LLRR118 pKa = 11.84KK119 pKa = 9.8SSPLLVSYY127 pKa = 10.7HH128 pKa = 6.35DD129 pKa = 3.99TPVHH133 pKa = 5.64IRR135 pKa = 11.84GLTSPHH141 pKa = 5.78NFYY144 pKa = 11.12TNVEE148 pKa = 4.11FSLVRR153 pKa = 11.84RR154 pKa = 11.84NTGLQRR160 pKa = 11.84RR161 pKa = 11.84IDD163 pKa = 4.17RR164 pKa = 11.84LRR166 pKa = 11.84MWGPHH171 pKa = 5.83LPWVRR176 pKa = 11.84NKK178 pKa = 10.49NLLKK182 pKa = 10.86LPVRR186 pKa = 11.84HH187 pKa = 6.22
MM1 pKa = 7.74LIKK4 pKa = 10.54KK5 pKa = 9.72LLYY8 pKa = 9.57PRR10 pKa = 11.84TVDD13 pKa = 3.72GFLDD17 pKa = 3.56QLEE20 pKa = 4.53EE21 pKa = 4.22KK22 pKa = 10.95VMALSSVKK30 pKa = 9.83TNNYY34 pKa = 8.48YY35 pKa = 10.97DD36 pKa = 4.26LVFATLRR43 pKa = 11.84EE44 pKa = 4.28EE45 pKa = 4.43YY46 pKa = 9.79EE47 pKa = 3.53NWMEE51 pKa = 4.34LRR53 pKa = 11.84VFPKK57 pKa = 10.16IKK59 pKa = 9.84EE60 pKa = 3.82QRR62 pKa = 11.84QTVRR66 pKa = 11.84LVNVSIKK73 pKa = 9.46TNNRR77 pKa = 11.84NRR79 pKa = 11.84EE80 pKa = 3.9RR81 pKa = 11.84LFFRR85 pKa = 11.84LPVVVGSRR93 pKa = 11.84MDD95 pKa = 3.23KK96 pKa = 10.86KK97 pKa = 10.47EE98 pKa = 4.02CSKK101 pKa = 11.03KK102 pKa = 9.64NHH104 pKa = 6.16FCRR107 pKa = 11.84GYY109 pKa = 11.12DD110 pKa = 3.51EE111 pKa = 5.16TDD113 pKa = 3.12LDD115 pKa = 4.64LLRR118 pKa = 11.84KK119 pKa = 9.8SSPLLVSYY127 pKa = 10.7HH128 pKa = 6.35DD129 pKa = 3.99TPVHH133 pKa = 5.64IRR135 pKa = 11.84GLTSPHH141 pKa = 5.78NFYY144 pKa = 11.12TNVEE148 pKa = 4.11FSLVRR153 pKa = 11.84RR154 pKa = 11.84NTGLQRR160 pKa = 11.84RR161 pKa = 11.84IDD163 pKa = 4.17RR164 pKa = 11.84LRR166 pKa = 11.84MWGPHH171 pKa = 5.83LPWVRR176 pKa = 11.84NKK178 pKa = 10.49NLLKK182 pKa = 10.86LPVRR186 pKa = 11.84HH187 pKa = 6.22
Molecular weight: 22.43 kDa
Isoelectric point according different methods:
Peptides (in silico digests for buttom-up proteomics)
Below you can find in silico digests of the whole proteome with Trypsin, Chymotrypsin, Trypsin+LysC, LysN, ArgC proteases suitable for different mass spec machines.| Try ESI |
 |
|---|
| ChTry ESI |
 |
|---|
| ArgC ESI |
 |
|---|
| LysN ESI |
 |
|---|
| TryLysC ESI |
 |
|---|
| Try MALDI |
 |
|---|
| ChTry MALDI |
 |
|---|
| ArgC MALDI |
 |
|---|
| LysN MALDI |
 |
|---|
| TryLysC MALDI |
 |
|---|
| Try LTQ |
 |
|---|
| ChTry LTQ |
 |
|---|
| ArgC LTQ |
 |
|---|
| LysN LTQ |
 |
|---|
| TryLysC LTQ |
 |
|---|
| Try MSlow |
 |
|---|
| ChTry MSlow |
 |
|---|
| ArgC MSlow |
 |
|---|
| LysN MSlow |
 |
|---|
| TryLysC MSlow |
 |
|---|
| Try MShigh |
 |
|---|
| ChTry MShigh |
 |
|---|
| ArgC MShigh |
 |
|---|
| LysN MShigh |
 |
|---|
| TryLysC MShigh |
 |
|---|
General Statistics
Number of major isoforms |
Number of additional isoforms |
Number of all proteins |
Number of amino acids |
Min. Seq. Length |
Max. Seq. Length |
Avg. Seq. Length |
Avg. Mol. Weight |
|---|---|---|---|---|---|---|---|
0 |
72999 |
37 |
3529 |
368.7 |
41.74 |
Amino acid frequency
Ala |
Cys |
Asp |
Glu |
Phe |
Gly |
His |
Ile |
Lys |
Leu |
|---|---|---|---|---|---|---|---|---|---|
5.559 ± 0.114 | 0.718 ± 0.049 |
6.554 ± 0.105 | 7.489 ± 0.127 |
4.159 ± 0.067 | 6.464 ± 0.211 |
2.19 ± 0.099 | 5.767 ± 0.097 |
6.017 ± 0.173 | 9.237 ± 0.213 |
Met |
Asn |
Gln |
Pro |
Arg |
Ser |
Thr |
Val |
Trp |
Tyr |
|---|---|---|---|---|---|---|---|---|---|
2.643 ± 0.103 | 5.275 ± 0.1 |
4.143 ± 0.113 | 3.526 ± 0.091 |
4.974 ± 0.158 | 6.352 ± 0.112 |
6.725 ± 0.261 | 7.104 ± 0.219 |
1.175 ± 0.044 | 3.929 ± 0.107 |
Most of the basic statistics you can see at this page can be downloaded from this CSV file
Proteome-pI is available under Creative Commons Attribution-NoDerivs license, for more details see here
| Reference: Kozlowski LP. Proteome-pI 2.0: Proteome Isoelectric Point Database Update. Nucleic Acids Res. 2021, doi: 10.1093/nar/gkab944 | Contact: Lukasz P. Kozlowski |
