Avian orthoreovirus
Taxonomy: Viruses; Riboviria; Orthornavirae; Duplornaviricota; Resentoviricetes; Reovirales; Reoviridae; Spinareovirinae; Orthoreovirus
Average proteome isoelectric point is 6.33
Get precalculated fractions of proteins

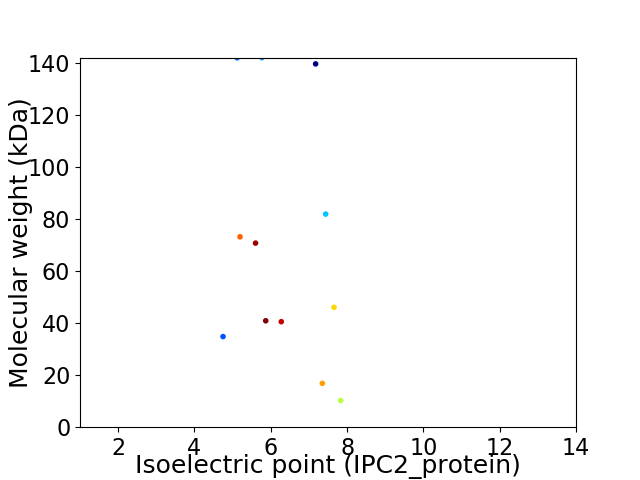
Virtual 2D-PAGE plot for 12 proteins (isoelectric point calculated using IPC2_protein)
Get csv file with sequences according to given criteria:
* You can choose from 21 different methods for calculating isoelectric point
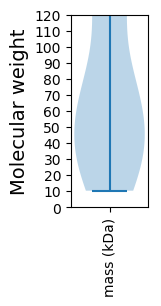
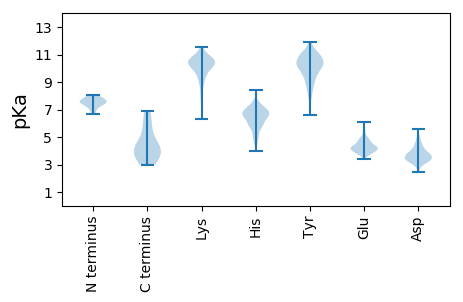
Summary statistics related to proteome-wise predictions


Protein with the lowest isoelectric point:
>tr|A0A0A0QNN6|A0A0A0QNN6_9REOV Lambda-A protein OS=Avian orthoreovirus OX=38170 PE=4 SV=1
MM1 pKa = 7.65AGLNPSQRR9 pKa = 11.84RR10 pKa = 11.84EE11 pKa = 4.05VVSLILSLTSNVTISHH27 pKa = 6.87GDD29 pKa = 3.15LTPIYY34 pKa = 10.28EE35 pKa = 4.23RR36 pKa = 11.84LTNLEE41 pKa = 4.02ASTEE45 pKa = 3.98LLHH48 pKa = 7.69RR49 pKa = 11.84SISDD53 pKa = 2.8ISTTVSNISANLQDD67 pKa = 3.83MTHH70 pKa = 7.01ILDD73 pKa = 4.86DD74 pKa = 3.6VTANLDD80 pKa = 3.68GLRR83 pKa = 11.84TTVTALQDD91 pKa = 3.64FVSILSTNVTDD102 pKa = 4.29LTNTSSAHH110 pKa = 6.06AATLSLLQTTVDD122 pKa = 3.85GNSTAISNLKK132 pKa = 10.39SDD134 pKa = 3.63VSSNGLAITDD144 pKa = 3.58LQDD147 pKa = 3.09RR148 pKa = 11.84VKK150 pKa = 10.73SLEE153 pKa = 3.99STASHH158 pKa = 6.46GLSFSPPLSVADD170 pKa = 3.95GVVSLDD176 pKa = 3.35MDD178 pKa = 4.77PYY180 pKa = 10.25FCSQRR185 pKa = 11.84VSLTSYY191 pKa = 10.23SAEE194 pKa = 3.78AQLMQFRR201 pKa = 11.84WMARR205 pKa = 11.84GTNGSSDD212 pKa = 4.26TIDD215 pKa = 3.26MTVNAHH221 pKa = 4.55CHH223 pKa = 4.55GRR225 pKa = 11.84RR226 pKa = 11.84TDD228 pKa = 3.5YY229 pKa = 11.04MMSSTGNLTVTSNVVLLTFDD249 pKa = 4.46LSDD252 pKa = 3.36ITHH255 pKa = 6.82IPSDD259 pKa = 3.94LARR262 pKa = 11.84LVPSAGFQAASFPVDD277 pKa = 3.17VSFTRR282 pKa = 11.84DD283 pKa = 3.46SATHH287 pKa = 7.2AYY289 pKa = 8.45QAYY292 pKa = 9.19GVYY295 pKa = 10.18SSSRR299 pKa = 11.84VFTITFPTGGDD310 pKa = 3.06GTANIRR316 pKa = 11.84SLTVRR321 pKa = 11.84TGIDD325 pKa = 3.04TT326 pKa = 3.86
MM1 pKa = 7.65AGLNPSQRR9 pKa = 11.84RR10 pKa = 11.84EE11 pKa = 4.05VVSLILSLTSNVTISHH27 pKa = 6.87GDD29 pKa = 3.15LTPIYY34 pKa = 10.28EE35 pKa = 4.23RR36 pKa = 11.84LTNLEE41 pKa = 4.02ASTEE45 pKa = 3.98LLHH48 pKa = 7.69RR49 pKa = 11.84SISDD53 pKa = 2.8ISTTVSNISANLQDD67 pKa = 3.83MTHH70 pKa = 7.01ILDD73 pKa = 4.86DD74 pKa = 3.6VTANLDD80 pKa = 3.68GLRR83 pKa = 11.84TTVTALQDD91 pKa = 3.64FVSILSTNVTDD102 pKa = 4.29LTNTSSAHH110 pKa = 6.06AATLSLLQTTVDD122 pKa = 3.85GNSTAISNLKK132 pKa = 10.39SDD134 pKa = 3.63VSSNGLAITDD144 pKa = 3.58LQDD147 pKa = 3.09RR148 pKa = 11.84VKK150 pKa = 10.73SLEE153 pKa = 3.99STASHH158 pKa = 6.46GLSFSPPLSVADD170 pKa = 3.95GVVSLDD176 pKa = 3.35MDD178 pKa = 4.77PYY180 pKa = 10.25FCSQRR185 pKa = 11.84VSLTSYY191 pKa = 10.23SAEE194 pKa = 3.78AQLMQFRR201 pKa = 11.84WMARR205 pKa = 11.84GTNGSSDD212 pKa = 4.26TIDD215 pKa = 3.26MTVNAHH221 pKa = 4.55CHH223 pKa = 4.55GRR225 pKa = 11.84RR226 pKa = 11.84TDD228 pKa = 3.5YY229 pKa = 11.04MMSSTGNLTVTSNVVLLTFDD249 pKa = 4.46LSDD252 pKa = 3.36ITHH255 pKa = 6.82IPSDD259 pKa = 3.94LARR262 pKa = 11.84LVPSAGFQAASFPVDD277 pKa = 3.17VSFTRR282 pKa = 11.84DD283 pKa = 3.46SATHH287 pKa = 7.2AYY289 pKa = 8.45QAYY292 pKa = 9.19GVYY295 pKa = 10.18SSSRR299 pKa = 11.84VFTITFPTGGDD310 pKa = 3.06GTANIRR316 pKa = 11.84SLTVRR321 pKa = 11.84TGIDD325 pKa = 3.04TT326 pKa = 3.86
Molecular weight: 34.86 kDa
Isoelectric point according different methods:
Protein with the highest isoelectric point:
>tr|O12286|O12286_9REOV 17 kDa protein OS=Avian orthoreovirus OX=38170 PE=4 SV=1
MM1 pKa = 7.61LRR3 pKa = 11.84MPPGSCNGATAVFGNVHH20 pKa = 6.01CQAAQNTAGGDD31 pKa = 3.67LQATSSIIAYY41 pKa = 8.46WPYY44 pKa = 10.5LAAGGGFLLIVIIFALLYY62 pKa = 9.68CCKK65 pKa = 10.66AKK67 pKa = 10.82VKK69 pKa = 10.62ADD71 pKa = 3.44AARR74 pKa = 11.84SVFHH78 pKa = 7.18RR79 pKa = 11.84EE80 pKa = 3.58LVALSSGKK88 pKa = 9.54HH89 pKa = 4.76NAMAPPYY96 pKa = 10.3DD97 pKa = 3.6VV98 pKa = 4.1
MM1 pKa = 7.61LRR3 pKa = 11.84MPPGSCNGATAVFGNVHH20 pKa = 6.01CQAAQNTAGGDD31 pKa = 3.67LQATSSIIAYY41 pKa = 8.46WPYY44 pKa = 10.5LAAGGGFLLIVIIFALLYY62 pKa = 9.68CCKK65 pKa = 10.66AKK67 pKa = 10.82VKK69 pKa = 10.62ADD71 pKa = 3.44AARR74 pKa = 11.84SVFHH78 pKa = 7.18RR79 pKa = 11.84EE80 pKa = 3.58LVALSSGKK88 pKa = 9.54HH89 pKa = 4.76NAMAPPYY96 pKa = 10.3DD97 pKa = 3.6VV98 pKa = 4.1
Molecular weight: 10.27 kDa
Isoelectric point according different methods:
Peptides (in silico digests for buttom-up proteomics)
Below you can find in silico digests of the whole proteome with Trypsin, Chymotrypsin, Trypsin+LysC, LysN, ArgC proteases suitable for different mass spec machines.| Try ESI |
 |
|---|
| ChTry ESI |
 |
|---|
| ArgC ESI |
 |
|---|
| LysN ESI |
 |
|---|
| TryLysC ESI |
 |
|---|
| Try MALDI |
 |
|---|
| ChTry MALDI |
 |
|---|
| ArgC MALDI |
 |
|---|
| LysN MALDI |
 |
|---|
| TryLysC MALDI |
 |
|---|
| Try LTQ |
 |
|---|
| ChTry LTQ |
 |
|---|
| ArgC LTQ |
 |
|---|
| LysN LTQ |
 |
|---|
| TryLysC LTQ |
 |
|---|
| Try MSlow |
 |
|---|
| ChTry MSlow |
 |
|---|
| ArgC MSlow |
 |
|---|
| LysN MSlow |
 |
|---|
| TryLysC MSlow |
 |
|---|
| Try MShigh |
 |
|---|
| ChTry MShigh |
 |
|---|
| ArgC MShigh |
 |
|---|
| LysN MShigh |
 |
|---|
| TryLysC MShigh |
 |
|---|
General Statistics
Number of major isoforms |
Number of additional isoforms |
Number of all proteins |
Number of amino acids |
Min. Seq. Length |
Max. Seq. Length |
Avg. Seq. Length |
Avg. Mol. Weight |
|---|---|---|---|---|---|---|---|
0 |
7600 |
98 |
1293 |
633.3 |
69.98 |
Amino acid frequency
Ala |
Cys |
Asp |
Glu |
Phe |
Gly |
His |
Ile |
Lys |
Leu |
|---|---|---|---|---|---|---|---|---|---|
8.395 ± 0.466 | 1.632 ± 0.138 |
6.145 ± 0.226 | 3.408 ± 0.363 |
4.0 ± 0.327 | 5.0 ± 0.262 |
2.039 ± 0.194 | 4.803 ± 0.212 |
2.711 ± 0.27 | 10.276 ± 0.5 |
Met |
Asn |
Gln |
Pro |
Arg |
Ser |
Thr |
Val |
Trp |
Tyr |
|---|---|---|---|---|---|---|---|---|---|
2.579 ± 0.231 | 4.013 ± 0.401 |
6.145 ± 0.373 | 3.961 ± 0.351 |
5.987 ± 0.331 | 9.829 ± 0.416 |
7.197 ± 0.598 | 7.289 ± 0.264 |
1.566 ± 0.159 | 3.026 ± 0.191 |
Most of the basic statistics you can see at this page can be downloaded from this CSV file
Proteome-pI is available under Creative Commons Attribution-NoDerivs license, for more details see here
| Reference: Kozlowski LP. Proteome-pI 2.0: Proteome Isoelectric Point Database Update. Nucleic Acids Res. 2021, doi: 10.1093/nar/gkab944 | Contact: Lukasz P. Kozlowski |
