Leishmania major
Taxonomy: cellular organisms; Eukaryota; Discoba; Euglenozoa; Kinetoplastea; Metakinetoplastina; Trypanosomatida; Trypanosomatidae; Leishmaniinae; Leishmania; Leishmania; Leishmania major species complex
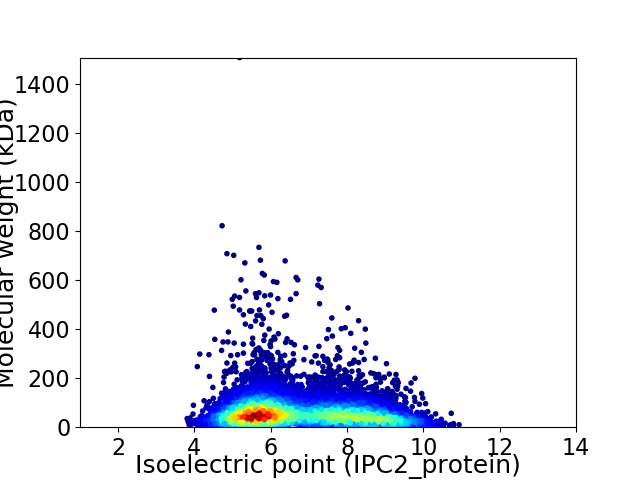
Average proteome isoelectric point is 6.75
Get precalculated fractions of proteins

Virtual 2D-PAGE plot for 8038 proteins (isoelectric point calculated using IPC2_protein)
Get csv file with sequences according to given criteria:
* You can choose from 21 different methods for calculating isoelectric point
Summary statistics related to proteome-wise predictions


Protein with the lowest isoelectric point:
>tr|O97204|O97204_LEIMA Uncharacterized protein OS=Leishmania major OX=5664 GN=LMJF_04_0510 PE=4 SV=1
MM1 pKa = 7.78SDD3 pKa = 3.49YY4 pKa = 11.4SSDD7 pKa = 3.96DD8 pKa = 3.33EE9 pKa = 4.82DD10 pKa = 4.37VVVLQVCANRR20 pKa = 11.84HH21 pKa = 4.79CQGIDD26 pKa = 3.15DD27 pKa = 5.04LEE29 pKa = 5.2FDD31 pKa = 3.95EE32 pKa = 5.12EE33 pKa = 4.87TNQSYY38 pKa = 10.79CGRR41 pKa = 11.84CRR43 pKa = 11.84ALYY46 pKa = 10.61ARR48 pKa = 11.84TEE50 pKa = 4.3TEE52 pKa = 3.84GFRR55 pKa = 11.84VLLSNDD61 pKa = 3.21DD62 pKa = 3.86LGLVKK67 pKa = 10.81LIFDD71 pKa = 3.67QFDD74 pKa = 3.55EE75 pKa = 4.26NSRR78 pKa = 11.84GFWTYY83 pKa = 11.29KK84 pKa = 8.83EE85 pKa = 3.87WNAFQEE91 pKa = 4.43VTEE94 pKa = 4.97RR95 pKa = 11.84GSDD98 pKa = 3.68DD99 pKa = 4.62PIEE102 pKa = 4.43SSAALKK108 pKa = 10.68EE109 pKa = 4.33FFKK112 pKa = 11.07EE113 pKa = 4.32EE114 pKa = 3.83YY115 pKa = 10.49DD116 pKa = 3.47IDD118 pKa = 3.71ISAHH122 pKa = 5.56GKK124 pKa = 10.13DD125 pKa = 3.6GAVVLLVDD133 pKa = 5.01LEE135 pKa = 4.13NMYY138 pKa = 10.99GGYY141 pKa = 10.52LYY143 pKa = 11.21NNVDD147 pKa = 3.65ALVEE151 pKa = 4.18DD152 pKa = 4.41SEE154 pKa = 4.4AMEE157 pKa = 4.28YY158 pKa = 10.27QGLLHH163 pKa = 6.41TGVLEE168 pKa = 4.11
MM1 pKa = 7.78SDD3 pKa = 3.49YY4 pKa = 11.4SSDD7 pKa = 3.96DD8 pKa = 3.33EE9 pKa = 4.82DD10 pKa = 4.37VVVLQVCANRR20 pKa = 11.84HH21 pKa = 4.79CQGIDD26 pKa = 3.15DD27 pKa = 5.04LEE29 pKa = 5.2FDD31 pKa = 3.95EE32 pKa = 5.12EE33 pKa = 4.87TNQSYY38 pKa = 10.79CGRR41 pKa = 11.84CRR43 pKa = 11.84ALYY46 pKa = 10.61ARR48 pKa = 11.84TEE50 pKa = 4.3TEE52 pKa = 3.84GFRR55 pKa = 11.84VLLSNDD61 pKa = 3.21DD62 pKa = 3.86LGLVKK67 pKa = 10.81LIFDD71 pKa = 3.67QFDD74 pKa = 3.55EE75 pKa = 4.26NSRR78 pKa = 11.84GFWTYY83 pKa = 11.29KK84 pKa = 8.83EE85 pKa = 3.87WNAFQEE91 pKa = 4.43VTEE94 pKa = 4.97RR95 pKa = 11.84GSDD98 pKa = 3.68DD99 pKa = 4.62PIEE102 pKa = 4.43SSAALKK108 pKa = 10.68EE109 pKa = 4.33FFKK112 pKa = 11.07EE113 pKa = 4.32EE114 pKa = 3.83YY115 pKa = 10.49DD116 pKa = 3.47IDD118 pKa = 3.71ISAHH122 pKa = 5.56GKK124 pKa = 10.13DD125 pKa = 3.6GAVVLLVDD133 pKa = 5.01LEE135 pKa = 4.13NMYY138 pKa = 10.99GGYY141 pKa = 10.52LYY143 pKa = 11.21NNVDD147 pKa = 3.65ALVEE151 pKa = 4.18DD152 pKa = 4.41SEE154 pKa = 4.4AMEE157 pKa = 4.28YY158 pKa = 10.27QGLLHH163 pKa = 6.41TGVLEE168 pKa = 4.11
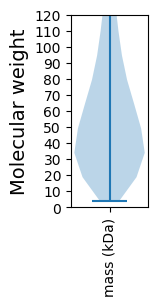
Molecular weight: 19.14 kDa
Isoelectric point according different methods:
Protein with the highest isoelectric point:
>tr|Q4Q1G9|Q4Q1G9_LEIMA Uncharacterized protein OS=Leishmania major OX=5664 GN=LMJF_36_2520 PE=4 SV=1
MM1 pKa = 7.63AKK3 pKa = 10.06SKK5 pKa = 10.65NHH7 pKa = 5.76TNHH10 pKa = 5.7NQSSKK15 pKa = 7.51NHH17 pKa = 6.0RR18 pKa = 11.84NGIKK22 pKa = 10.6GPVPLHH28 pKa = 5.48LHH30 pKa = 4.88NSKK33 pKa = 10.54RR34 pKa = 11.84GSWLPALVNARR45 pKa = 11.84RR46 pKa = 11.84VRR48 pKa = 11.84KK49 pKa = 9.49HH50 pKa = 4.74NQKK53 pKa = 10.61AALKK57 pKa = 9.79KK58 pKa = 9.32RR59 pKa = 11.84RR60 pKa = 11.84EE61 pKa = 4.05RR62 pKa = 11.84IAAFAAKK69 pKa = 9.96NN70 pKa = 3.41
MM1 pKa = 7.63AKK3 pKa = 10.06SKK5 pKa = 10.65NHH7 pKa = 5.76TNHH10 pKa = 5.7NQSSKK15 pKa = 7.51NHH17 pKa = 6.0RR18 pKa = 11.84NGIKK22 pKa = 10.6GPVPLHH28 pKa = 5.48LHH30 pKa = 4.88NSKK33 pKa = 10.54RR34 pKa = 11.84GSWLPALVNARR45 pKa = 11.84RR46 pKa = 11.84VRR48 pKa = 11.84KK49 pKa = 9.49HH50 pKa = 4.74NQKK53 pKa = 10.61AALKK57 pKa = 9.79KK58 pKa = 9.32RR59 pKa = 11.84RR60 pKa = 11.84EE61 pKa = 4.05RR62 pKa = 11.84IAAFAAKK69 pKa = 9.96NN70 pKa = 3.41
Molecular weight: 7.98 kDa
Isoelectric point according different methods:
Peptides (in silico digests for buttom-up proteomics)
Below you can find in silico digests of the whole proteome with Trypsin, Chymotrypsin, Trypsin+LysC, LysN, ArgC proteases suitable for different mass spec machines.| Try ESI |
 |
|---|
| ChTry ESI |
 |
|---|
| ArgC ESI |
 |
|---|
| LysN ESI |
 |
|---|
| TryLysC ESI |
 |
|---|
| Try MALDI |
 |
|---|
| ChTry MALDI |
 |
|---|
| ArgC MALDI |
 |
|---|
| LysN MALDI |
 |
|---|
| TryLysC MALDI |
 |
|---|
| Try LTQ |
 |
|---|
| ChTry LTQ |
 |
|---|
| ArgC LTQ |
 |
|---|
| LysN LTQ |
 |
|---|
| TryLysC LTQ |
 |
|---|
| Try MSlow |
 |
|---|
| ChTry MSlow |
 |
|---|
| ArgC MSlow |
 |
|---|
| LysN MSlow |
 |
|---|
| TryLysC MSlow |
 |
|---|
| Try MShigh |
 |
|---|
| ChTry MShigh |
 |
|---|
| ArgC MShigh |
 |
|---|
| LysN MShigh |
 |
|---|
| TryLysC MShigh |
 |
|---|
General Statistics
Number of major isoforms |
Number of additional isoforms |
Number of all proteins |
Number of amino acids |
Min. Seq. Length |
Max. Seq. Length |
Avg. Seq. Length |
Avg. Mol. Weight |
|---|---|---|---|---|---|---|---|
0 |
5143074 |
31 |
17392 |
639.8 |
69.48 |
Amino acid frequency
Ala |
Cys |
Asp |
Glu |
Phe |
Gly |
His |
Ile |
Lys |
Leu |
|---|---|---|---|---|---|---|---|---|---|
12.066 ± 0.051 | 1.892 ± 0.013 |
4.858 ± 0.023 | 5.974 ± 0.041 |
2.946 ± 0.018 | 6.457 ± 0.036 |
2.713 ± 0.015 | 2.96 ± 0.019 |
3.288 ± 0.023 | 9.195 ± 0.041 |
Met |
Asn |
Gln |
Pro |
Arg |
Ser |
Thr |
Val |
Trp |
Tyr |
|---|---|---|---|---|---|---|---|---|---|
2.242 ± 0.013 | 2.608 ± 0.016 |
5.817 ± 0.034 | 4.104 ± 0.025 |
7.185 ± 0.037 | 9.046 ± 0.21 |
6.019 ± 0.027 | 7.152 ± 0.032 |
1.08 ± 0.009 | 2.4 ± 0.018 |
Most of the basic statistics you can see at this page can be downloaded from this CSV file
Proteome-pI is available under Creative Commons Attribution-NoDerivs license, for more details see here
| Reference: Kozlowski LP. Proteome-pI 2.0: Proteome Isoelectric Point Database Update. Nucleic Acids Res. 2021, doi: 10.1093/nar/gkab944 | Contact: Lukasz P. Kozlowski |
