Subterranean clover stunt virus (strain F) (SCSV)
Taxonomy: Viruses; Monodnaviria; Shotokuvirae; Cressdnaviricota; Arfiviricetes; Mulpavirales; Nanoviridae; Nanovirus; Subterranean clover stunt virus
Average proteome isoelectric point is 6.56
Get precalculated fractions of proteins

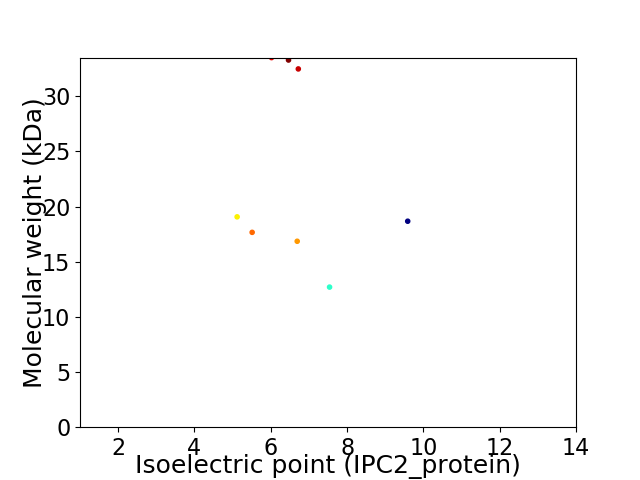
Virtual 2D-PAGE plot for 8 proteins (isoelectric point calculated using IPC2_protein)
Get csv file with sequences according to given criteria:
* You can choose from 21 different methods for calculating isoelectric point
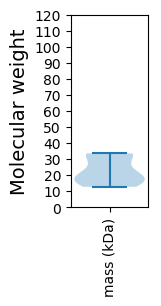
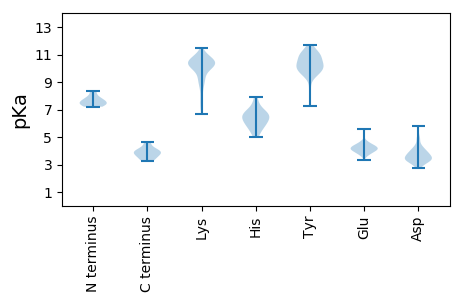
Summary statistics related to proteome-wise predictions


Protein with the lowest isoelectric point:
>sp|Q87011|NSP_SCSVF Putative nuclear shuttle protein OS=Subterranean clover stunt virus (strain F) OX=291607 GN=DNA-N PE=3 SV=1
MM1 pKa = 7.48ALRR4 pKa = 11.84YY5 pKa = 8.98FSHH8 pKa = 7.56LPEE11 pKa = 4.22EE12 pKa = 4.36LKK14 pKa = 10.74EE15 pKa = 4.32KK16 pKa = 10.58IMNEE20 pKa = 3.59HH21 pKa = 6.31LKK23 pKa = 10.32EE24 pKa = 4.04IKK26 pKa = 10.25KK27 pKa = 10.55KK28 pKa = 10.27EE29 pKa = 3.8FLEE32 pKa = 4.11NVIKK36 pKa = 10.4AACAVFEE43 pKa = 4.22GLTKK47 pKa = 10.36KK48 pKa = 10.74EE49 pKa = 4.25SVEE52 pKa = 3.74EE53 pKa = 3.91DD54 pKa = 3.73DD55 pKa = 4.07ILRR58 pKa = 11.84FSGFLEE64 pKa = 4.41GLSAYY69 pKa = 9.89YY70 pKa = 10.87AEE72 pKa = 4.31ATKK75 pKa = 10.49KK76 pKa = 10.24KK77 pKa = 10.69CLVRR81 pKa = 11.84WKK83 pKa = 10.58KK84 pKa = 10.72SVAINLKK91 pKa = 7.71WRR93 pKa = 11.84VMEE96 pKa = 4.0EE97 pKa = 3.64MHH99 pKa = 6.26YY100 pKa = 10.89KK101 pKa = 10.76LYY103 pKa = 11.14GFADD107 pKa = 4.04MEE109 pKa = 4.39DD110 pKa = 4.86LYY112 pKa = 11.24CSEE115 pKa = 5.53LGFPNYY121 pKa = 10.8GEE123 pKa = 5.39DD124 pKa = 3.91DD125 pKa = 3.72VAYY128 pKa = 10.4HH129 pKa = 7.32DD130 pKa = 4.47GAIVNCKK137 pKa = 8.04QLEE140 pKa = 4.44VVFDD144 pKa = 4.11DD145 pKa = 4.95LGIEE149 pKa = 4.24FMSIVIDD156 pKa = 3.64RR157 pKa = 11.84GSIKK161 pKa = 10.15IEE163 pKa = 3.88LL164 pKa = 3.92
MM1 pKa = 7.48ALRR4 pKa = 11.84YY5 pKa = 8.98FSHH8 pKa = 7.56LPEE11 pKa = 4.22EE12 pKa = 4.36LKK14 pKa = 10.74EE15 pKa = 4.32KK16 pKa = 10.58IMNEE20 pKa = 3.59HH21 pKa = 6.31LKK23 pKa = 10.32EE24 pKa = 4.04IKK26 pKa = 10.25KK27 pKa = 10.55KK28 pKa = 10.27EE29 pKa = 3.8FLEE32 pKa = 4.11NVIKK36 pKa = 10.4AACAVFEE43 pKa = 4.22GLTKK47 pKa = 10.36KK48 pKa = 10.74EE49 pKa = 4.25SVEE52 pKa = 3.74EE53 pKa = 3.91DD54 pKa = 3.73DD55 pKa = 4.07ILRR58 pKa = 11.84FSGFLEE64 pKa = 4.41GLSAYY69 pKa = 9.89YY70 pKa = 10.87AEE72 pKa = 4.31ATKK75 pKa = 10.49KK76 pKa = 10.24KK77 pKa = 10.69CLVRR81 pKa = 11.84WKK83 pKa = 10.58KK84 pKa = 10.72SVAINLKK91 pKa = 7.71WRR93 pKa = 11.84VMEE96 pKa = 4.0EE97 pKa = 3.64MHH99 pKa = 6.26YY100 pKa = 10.89KK101 pKa = 10.76LYY103 pKa = 11.14GFADD107 pKa = 4.04MEE109 pKa = 4.39DD110 pKa = 4.86LYY112 pKa = 11.24CSEE115 pKa = 5.53LGFPNYY121 pKa = 10.8GEE123 pKa = 5.39DD124 pKa = 3.91DD125 pKa = 3.72VAYY128 pKa = 10.4HH129 pKa = 7.32DD130 pKa = 4.47GAIVNCKK137 pKa = 8.04QLEE140 pKa = 4.44VVFDD144 pKa = 4.11DD145 pKa = 4.95LGIEE149 pKa = 4.24FMSIVIDD156 pKa = 3.64RR157 pKa = 11.84GSIKK161 pKa = 10.15IEE163 pKa = 3.88LL164 pKa = 3.92
Molecular weight: 19.07 kDa
Isoelectric point according different methods:
Protein with the highest isoelectric point:
>sp|Q87013|REP6_SCSVF Para-Rep C6 OS=Subterranean clover stunt virus (strain F) OX=291607 GN=C6 PE=3 SV=1
MM1 pKa = 7.21VAVRR5 pKa = 11.84WGRR8 pKa = 11.84KK9 pKa = 6.69GLRR12 pKa = 11.84SQRR15 pKa = 11.84RR16 pKa = 11.84KK17 pKa = 9.78YY18 pKa = 10.97SRR20 pKa = 11.84IAYY23 pKa = 7.64KK24 pKa = 10.32PPSSKK29 pKa = 10.36VVSHH33 pKa = 6.27VEE35 pKa = 3.85SVLNKK40 pKa = 9.98RR41 pKa = 11.84DD42 pKa = 3.47VTGAEE47 pKa = 4.03VKK49 pKa = 10.44PFADD53 pKa = 4.2GSRR56 pKa = 11.84YY57 pKa = 9.71SMKK60 pKa = 10.53KK61 pKa = 9.85VMLIATLTMAPGEE74 pKa = 4.11LVNYY78 pKa = 9.44LIVKK82 pKa = 9.7SNSPIANWSSSFSNPSLMVKK102 pKa = 10.42EE103 pKa = 4.62SVQDD107 pKa = 3.33TVTIVGGGKK116 pKa = 9.93LEE118 pKa = 4.2SSGTAGKK125 pKa = 10.22DD126 pKa = 3.12VTKK129 pKa = 10.66SFRR132 pKa = 11.84KK133 pKa = 9.15FVKK136 pKa = 9.96LGSGISQTQHH146 pKa = 6.55LYY148 pKa = 11.09LIIYY152 pKa = 10.02SSDD155 pKa = 2.77AMKK158 pKa = 9.31ITLEE162 pKa = 3.66TRR164 pKa = 11.84MYY166 pKa = 10.75IDD168 pKa = 3.15VV169 pKa = 3.93
MM1 pKa = 7.21VAVRR5 pKa = 11.84WGRR8 pKa = 11.84KK9 pKa = 6.69GLRR12 pKa = 11.84SQRR15 pKa = 11.84RR16 pKa = 11.84KK17 pKa = 9.78YY18 pKa = 10.97SRR20 pKa = 11.84IAYY23 pKa = 7.64KK24 pKa = 10.32PPSSKK29 pKa = 10.36VVSHH33 pKa = 6.27VEE35 pKa = 3.85SVLNKK40 pKa = 9.98RR41 pKa = 11.84DD42 pKa = 3.47VTGAEE47 pKa = 4.03VKK49 pKa = 10.44PFADD53 pKa = 4.2GSRR56 pKa = 11.84YY57 pKa = 9.71SMKK60 pKa = 10.53KK61 pKa = 9.85VMLIATLTMAPGEE74 pKa = 4.11LVNYY78 pKa = 9.44LIVKK82 pKa = 9.7SNSPIANWSSSFSNPSLMVKK102 pKa = 10.42EE103 pKa = 4.62SVQDD107 pKa = 3.33TVTIVGGGKK116 pKa = 9.93LEE118 pKa = 4.2SSGTAGKK125 pKa = 10.22DD126 pKa = 3.12VTKK129 pKa = 10.66SFRR132 pKa = 11.84KK133 pKa = 9.15FVKK136 pKa = 9.96LGSGISQTQHH146 pKa = 6.55LYY148 pKa = 11.09LIIYY152 pKa = 10.02SSDD155 pKa = 2.77AMKK158 pKa = 9.31ITLEE162 pKa = 3.66TRR164 pKa = 11.84MYY166 pKa = 10.75IDD168 pKa = 3.15VV169 pKa = 3.93
Molecular weight: 18.67 kDa
Isoelectric point according different methods:
Peptides (in silico digests for buttom-up proteomics)
Below you can find in silico digests of the whole proteome with Trypsin, Chymotrypsin, Trypsin+LysC, LysN, ArgC proteases suitable for different mass spec machines.| Try ESI |
 |
|---|
| ChTry ESI |
 |
|---|
| ArgC ESI |
 |
|---|
| LysN ESI |
 |
|---|
| TryLysC ESI |
 |
|---|
| Try MALDI |
 |
|---|
| ChTry MALDI |
 |
|---|
| ArgC MALDI |
 |
|---|
| LysN MALDI |
 |
|---|
| TryLysC MALDI |
 |
|---|
| Try LTQ |
 |
|---|
| ChTry LTQ |
 |
|---|
| ArgC LTQ |
 |
|---|
| LysN LTQ |
 |
|---|
| TryLysC LTQ |
 |
|---|
| Try MSlow |
 |
|---|
| ChTry MSlow |
 |
|---|
| ArgC MSlow |
 |
|---|
| LysN MSlow |
 |
|---|
| TryLysC MSlow |
 |
|---|
| Try MShigh |
 |
|---|
| ChTry MShigh |
 |
|---|
| ArgC MShigh |
 |
|---|
| LysN MShigh |
 |
|---|
| TryLysC MShigh |
 |
|---|
General Statistics
Number of major isoforms |
Number of additional isoforms |
Number of all proteins |
Number of amino acids |
Min. Seq. Length |
Max. Seq. Length |
Avg. Seq. Length |
Avg. Mol. Weight |
|---|---|---|---|---|---|---|---|
0 |
1595 |
112 |
286 |
199.4 |
23.03 |
Amino acid frequency
Ala |
Cys |
Asp |
Glu |
Phe |
Gly |
His |
Ile |
Lys |
Leu |
|---|---|---|---|---|---|---|---|---|---|
4.953 ± 0.566 | 2.571 ± 0.417 |
5.643 ± 0.653 | 8.025 ± 0.993 |
4.075 ± 0.437 | 6.27 ± 0.335 |
1.944 ± 0.338 | 5.831 ± 0.331 |
7.649 ± 0.545 | 7.524 ± 0.425 |
Met |
Asn |
Gln |
Pro |
Arg |
Ser |
Thr |
Val |
Trp |
Tyr |
|---|---|---|---|---|---|---|---|---|---|
3.574 ± 0.137 | 3.824 ± 0.367 |
3.197 ± 0.527 | 3.26 ± 0.48 |
6.27 ± 0.482 | 6.959 ± 0.871 |
4.013 ± 0.471 | 7.774 ± 0.79 |
1.818 ± 0.25 | 4.828 ± 0.248 |
Most of the basic statistics you can see at this page can be downloaded from this CSV file
Proteome-pI is available under Creative Commons Attribution-NoDerivs license, for more details see here
| Reference: Kozlowski LP. Proteome-pI 2.0: Proteome Isoelectric Point Database Update. Nucleic Acids Res. 2021, doi: 10.1093/nar/gkab944 | Contact: Lukasz P. Kozlowski |
