Pseudozobellia thermophila
Taxonomy: cellular organisms; Bacteria; FCB group; Bacteroidetes/Chlorobi group; Bacteroidetes; Flavobacteriia; Flavobacteriales; Flavobacteriaceae; Pseudozobellia
Average proteome isoelectric point is 6.34
Get precalculated fractions of proteins
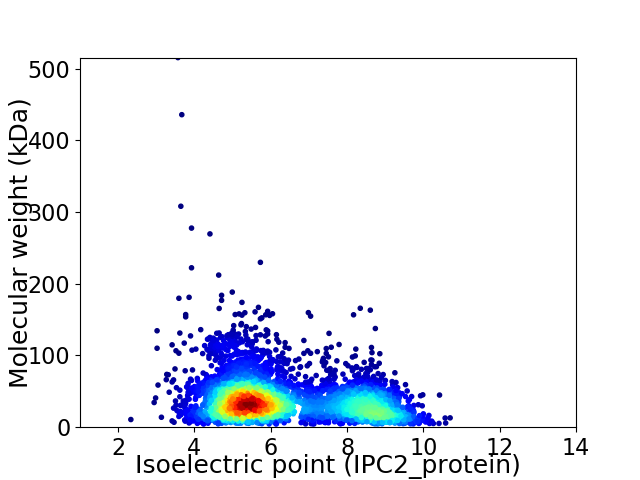
Virtual 2D-PAGE plot for 4169 proteins (isoelectric point calculated using IPC2_protein)
Get csv file with sequences according to given criteria:
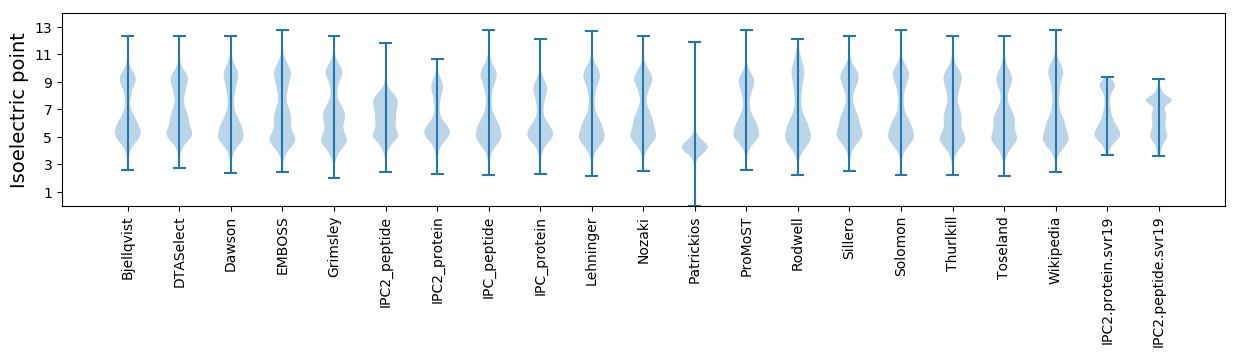
* You can choose from 21 different methods for calculating isoelectric point
Summary statistics related to proteome-wise predictions
Protein with the lowest isoelectric point:
>tr|A0A1M6KCS0|A0A1M6KCS0_9FLAO Predicted dehydrogenase OS=Pseudozobellia thermophila OX=192903 GN=SAMN04488513_10614 PE=4 SV=1
MM1 pKa = 7.31NRR3 pKa = 11.84TLSHH7 pKa = 6.16LQVLSLTFLSLLTFSSCSSDD27 pKa = 5.3DD28 pKa = 4.94DD29 pKa = 5.64DD30 pKa = 6.74DD31 pKa = 5.73NLGNWVDD38 pKa = 3.5RR39 pKa = 11.84SVFDD43 pKa = 3.56GSPRR47 pKa = 11.84SSVSGFTIGDD57 pKa = 3.51VGYY60 pKa = 9.62MGLGYY65 pKa = 10.86DD66 pKa = 4.13GDD68 pKa = 5.0DD69 pKa = 3.73YY70 pKa = 11.97LNSFWSYY77 pKa = 11.58DD78 pKa = 3.46LQGDD82 pKa = 3.99YY83 pKa = 10.26WSQKK87 pKa = 10.71ADD89 pKa = 3.81FPGSARR95 pKa = 11.84NAAVGFEE102 pKa = 4.05IDD104 pKa = 3.2GTGYY108 pKa = 10.72LGSGYY113 pKa = 10.57DD114 pKa = 4.02GLDD117 pKa = 3.5EE118 pKa = 5.97LSDD121 pKa = 4.15FYY123 pKa = 11.58AYY125 pKa = 10.37DD126 pKa = 3.87PSTNTWTEE134 pKa = 3.67IAPTPAAARR143 pKa = 11.84RR144 pKa = 11.84SAVAFGANGYY154 pKa = 10.42GYY156 pKa = 10.53FGTGYY161 pKa = 10.63DD162 pKa = 4.01GEE164 pKa = 4.31NDD166 pKa = 4.08RR167 pKa = 11.84KK168 pKa = 10.83DD169 pKa = 3.15FWKK172 pKa = 10.68YY173 pKa = 11.09DD174 pKa = 3.58PSTDD178 pKa = 3.01TWSEE182 pKa = 3.81LVGFGGDD189 pKa = 3.26KK190 pKa = 10.73RR191 pKa = 11.84RR192 pKa = 11.84DD193 pKa = 3.41AVTFTIDD200 pKa = 3.09NTVYY204 pKa = 10.97LGTGVSNGIYY214 pKa = 10.32LDD216 pKa = 4.59DD217 pKa = 4.7FWAFDD222 pKa = 4.15PSTEE226 pKa = 3.81TWTKK230 pKa = 11.04KK231 pKa = 10.49LDD233 pKa = 3.73LDD235 pKa = 4.33EE236 pKa = 5.32EE237 pKa = 4.85DD238 pKa = 4.83DD239 pKa = 4.03YY240 pKa = 12.08SIVRR244 pKa = 11.84SNAVAFTLNGYY255 pKa = 10.18GYY257 pKa = 9.5IACGYY262 pKa = 8.05ATGALGTVWEE272 pKa = 5.02YY273 pKa = 11.08IPGTDD278 pKa = 2.68SWEE281 pKa = 4.02AKK283 pKa = 9.58TSFEE287 pKa = 3.81GTTRR291 pKa = 11.84QDD293 pKa = 3.78AIAFSNGTRR302 pKa = 11.84AFVGLGRR309 pKa = 11.84SGTLYY314 pKa = 10.91LDD316 pKa = 4.55DD317 pKa = 5.55LDD319 pKa = 4.41EE320 pKa = 5.01FFPFDD325 pKa = 4.14EE326 pKa = 5.11YY327 pKa = 11.59DD328 pKa = 4.75DD329 pKa = 4.28EE330 pKa = 4.99DD331 pKa = 3.69
MM1 pKa = 7.31NRR3 pKa = 11.84TLSHH7 pKa = 6.16LQVLSLTFLSLLTFSSCSSDD27 pKa = 5.3DD28 pKa = 4.94DD29 pKa = 5.64DD30 pKa = 6.74DD31 pKa = 5.73NLGNWVDD38 pKa = 3.5RR39 pKa = 11.84SVFDD43 pKa = 3.56GSPRR47 pKa = 11.84SSVSGFTIGDD57 pKa = 3.51VGYY60 pKa = 9.62MGLGYY65 pKa = 10.86DD66 pKa = 4.13GDD68 pKa = 5.0DD69 pKa = 3.73YY70 pKa = 11.97LNSFWSYY77 pKa = 11.58DD78 pKa = 3.46LQGDD82 pKa = 3.99YY83 pKa = 10.26WSQKK87 pKa = 10.71ADD89 pKa = 3.81FPGSARR95 pKa = 11.84NAAVGFEE102 pKa = 4.05IDD104 pKa = 3.2GTGYY108 pKa = 10.72LGSGYY113 pKa = 10.57DD114 pKa = 4.02GLDD117 pKa = 3.5EE118 pKa = 5.97LSDD121 pKa = 4.15FYY123 pKa = 11.58AYY125 pKa = 10.37DD126 pKa = 3.87PSTNTWTEE134 pKa = 3.67IAPTPAAARR143 pKa = 11.84RR144 pKa = 11.84SAVAFGANGYY154 pKa = 10.42GYY156 pKa = 10.53FGTGYY161 pKa = 10.63DD162 pKa = 4.01GEE164 pKa = 4.31NDD166 pKa = 4.08RR167 pKa = 11.84KK168 pKa = 10.83DD169 pKa = 3.15FWKK172 pKa = 10.68YY173 pKa = 11.09DD174 pKa = 3.58PSTDD178 pKa = 3.01TWSEE182 pKa = 3.81LVGFGGDD189 pKa = 3.26KK190 pKa = 10.73RR191 pKa = 11.84RR192 pKa = 11.84DD193 pKa = 3.41AVTFTIDD200 pKa = 3.09NTVYY204 pKa = 10.97LGTGVSNGIYY214 pKa = 10.32LDD216 pKa = 4.59DD217 pKa = 4.7FWAFDD222 pKa = 4.15PSTEE226 pKa = 3.81TWTKK230 pKa = 11.04KK231 pKa = 10.49LDD233 pKa = 3.73LDD235 pKa = 4.33EE236 pKa = 5.32EE237 pKa = 4.85DD238 pKa = 4.83DD239 pKa = 4.03YY240 pKa = 12.08SIVRR244 pKa = 11.84SNAVAFTLNGYY255 pKa = 10.18GYY257 pKa = 9.5IACGYY262 pKa = 8.05ATGALGTVWEE272 pKa = 5.02YY273 pKa = 11.08IPGTDD278 pKa = 2.68SWEE281 pKa = 4.02AKK283 pKa = 9.58TSFEE287 pKa = 3.81GTTRR291 pKa = 11.84QDD293 pKa = 3.78AIAFSNGTRR302 pKa = 11.84AFVGLGRR309 pKa = 11.84SGTLYY314 pKa = 10.91LDD316 pKa = 4.55DD317 pKa = 5.55LDD319 pKa = 4.41EE320 pKa = 5.01FFPFDD325 pKa = 4.14EE326 pKa = 5.11YY327 pKa = 11.59DD328 pKa = 4.75DD329 pKa = 4.28EE330 pKa = 4.99DD331 pKa = 3.69
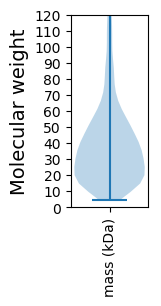
Molecular weight: 36.51 kDa
Isoelectric point according different methods:
Protein with the highest isoelectric point:
>tr|A0A1M6PAH8|A0A1M6PAH8_9FLAO Predicted naringenin-chalcone synthase OS=Pseudozobellia thermophila OX=192903 GN=SAMN04488513_11917 PE=3 SV=1
MM1 pKa = 7.69AEE3 pKa = 3.74RR4 pKa = 11.84RR5 pKa = 11.84KK6 pKa = 9.21MVRR9 pKa = 11.84KK10 pKa = 9.19GHH12 pKa = 6.0SKK14 pKa = 10.83LSISAQCRR22 pKa = 11.84SLGIHH27 pKa = 6.96RR28 pKa = 11.84SGLYY32 pKa = 9.02YY33 pKa = 10.28RR34 pKa = 11.84PRR36 pKa = 11.84GEE38 pKa = 4.12TEE40 pKa = 4.08LNLEE44 pKa = 4.44LMRR47 pKa = 11.84LMDD50 pKa = 3.57EE51 pKa = 4.65HH52 pKa = 8.1YY53 pKa = 10.34LYY55 pKa = 10.87HH56 pKa = 6.85PEE58 pKa = 3.96KK59 pKa = 10.0GAKK62 pKa = 9.27RR63 pKa = 11.84MHH65 pKa = 5.54VWLTRR70 pKa = 11.84DD71 pKa = 2.72KK72 pKa = 10.91GYY74 pKa = 10.65KK75 pKa = 9.03VSRR78 pKa = 11.84NRR80 pKa = 11.84II81 pKa = 3.5
MM1 pKa = 7.69AEE3 pKa = 3.74RR4 pKa = 11.84RR5 pKa = 11.84KK6 pKa = 9.21MVRR9 pKa = 11.84KK10 pKa = 9.19GHH12 pKa = 6.0SKK14 pKa = 10.83LSISAQCRR22 pKa = 11.84SLGIHH27 pKa = 6.96RR28 pKa = 11.84SGLYY32 pKa = 9.02YY33 pKa = 10.28RR34 pKa = 11.84PRR36 pKa = 11.84GEE38 pKa = 4.12TEE40 pKa = 4.08LNLEE44 pKa = 4.44LMRR47 pKa = 11.84LMDD50 pKa = 3.57EE51 pKa = 4.65HH52 pKa = 8.1YY53 pKa = 10.34LYY55 pKa = 10.87HH56 pKa = 6.85PEE58 pKa = 3.96KK59 pKa = 10.0GAKK62 pKa = 9.27RR63 pKa = 11.84MHH65 pKa = 5.54VWLTRR70 pKa = 11.84DD71 pKa = 2.72KK72 pKa = 10.91GYY74 pKa = 10.65KK75 pKa = 9.03VSRR78 pKa = 11.84NRR80 pKa = 11.84II81 pKa = 3.5
Molecular weight: 9.73 kDa
Isoelectric point according different methods:
Peptides (in silico digests for buttom-up proteomics)
Below you can find in silico digests of the whole proteome with Trypsin, Chymotrypsin, Trypsin+LysC, LysN, ArgC proteases suitable for different mass spec machines.| Try ESI |
 |
|---|
| ChTry ESI |
|
|---|
| ArgC ESI |
|
|---|
| LysN ESI |
|
|---|
| TryLysC ESI |
|
|---|
| Try MALDI |
|
|---|
| ChTry MALDI |
|
|---|
| ArgC MALDI |
|
|---|
| LysN MALDI |
|
|---|
| TryLysC MALDI |
|
|---|
| Try LTQ |
|
|---|
| ChTry LTQ |
|
|---|
| ArgC LTQ |
|
|---|
| LysN LTQ |
|
|---|
| TryLysC LTQ |
|
|---|
| Try MSlow |
|
|---|
| ChTry MSlow |
|
|---|
| ArgC MSlow |
|
|---|
| LysN MSlow |
|
|---|
| TryLysC MSlow |
|
|---|
| Try MShigh |
|
|---|
| ChTry MShigh |
|
|---|
| ArgC MShigh |
|
|---|
| LysN MShigh |
|
|---|
| TryLysC MShigh |
|
|---|
General Statistics
Number of major isoforms |
Number of additional isoforms |
Number of all proteins |
Number of amino acids |
Min. Seq. Length |
Max. Seq. Length |
Avg. Seq. Length |
Avg. Mol. Weight |
|---|---|---|---|---|---|---|---|
0 |
1506813 |
39 |
4873 |
361.4 |
40.6 |
Amino acid frequency
Ala |
Cys |
Asp |
Glu |
Phe |
Gly |
His |
Ile |
Lys |
Leu |
|---|---|---|---|---|---|---|---|---|---|
6.957 ± 0.033 | 0.743 ± 0.012 |
6.036 ± 0.034 | 6.713 ± 0.03 |
4.902 ± 0.027 | 7.3 ± 0.033 |
1.919 ± 0.017 | 6.747 ± 0.031 |
6.904 ± 0.044 | 9.386 ± 0.045 |
Met |
Asn |
Gln |
Pro |
Arg |
Ser |
Thr |
Val |
Trp |
Tyr |
|---|---|---|---|---|---|---|---|---|---|
2.27 ± 0.017 | 5.21 ± 0.03 |
3.892 ± 0.022 | 3.275 ± 0.016 |
4.157 ± 0.025 | 6.158 ± 0.03 |
5.583 ± 0.038 | 6.527 ± 0.03 |
1.211 ± 0.015 | 4.109 ± 0.024 |
Most of the basic statistics you can see at this page can be downloaded from this CSV file
See this proteome in:

Proteome-pI is available under Creative Commons Attribution-NoDerivs license, for more details see here
| Reference: Kozlowski LP. Proteome-pI 2.0: Proteome Isoelectric Point Database Update. Nucleic Acids Res. 2021, doi: 10.1093/nar/gkab944 | Contact: Lukasz P. Kozlowski |