Peptoniphilus ivorii
Taxonomy: cellular organisms; Bacteria; Terrabacteria group; Firmicutes; Tissierellia; Tissierellales; Peptoniphilaceae; Peptoniphilus
Average proteome isoelectric point is 6.09
Get precalculated fractions of proteins

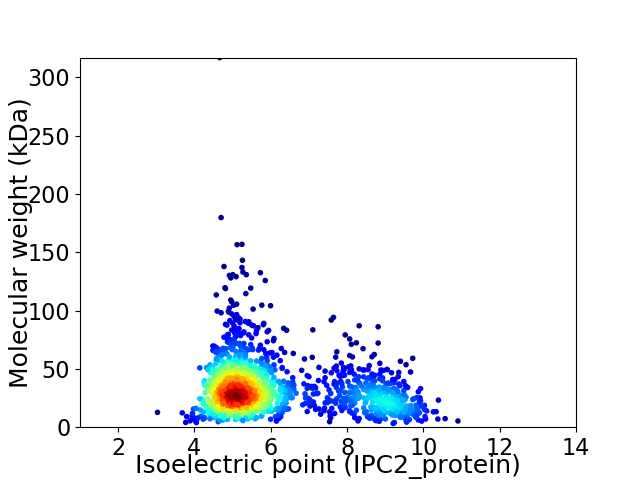
Virtual 2D-PAGE plot for 1499 proteins (isoelectric point calculated using IPC2_protein)
Get csv file with sequences according to given criteria:
* You can choose from 21 different methods for calculating isoelectric point
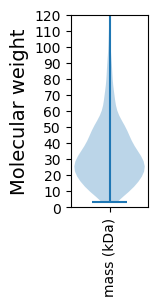
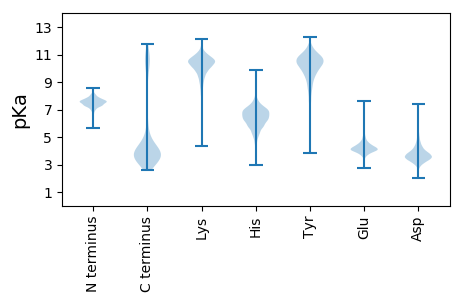
Summary statistics related to proteome-wise predictions


Protein with the lowest isoelectric point:
>tr|A0A448V1R2|A0A448V1R2_9FIRM UDP-N-acetylglucosamine--N-acetylmuramyl-(pentapeptide) pyrophosphoryl-undecaprenol N-acetylglucosamine transferase OS=Peptoniphilus ivorii OX=54006 GN=murG PE=3 SV=1
MM1 pKa = 7.22NRR3 pKa = 11.84QLFFDD8 pKa = 3.75EE9 pKa = 4.43MGNGISFIIKK19 pKa = 9.83ARR21 pKa = 11.84FRR23 pKa = 11.84VDD25 pKa = 3.14DD26 pKa = 4.0CDD28 pKa = 4.71YY29 pKa = 11.18IALLDD34 pKa = 4.56AEE36 pKa = 5.1HH37 pKa = 7.1IDD39 pKa = 3.59YY40 pKa = 8.25GTFILRR46 pKa = 11.84EE47 pKa = 4.14EE48 pKa = 4.36YY49 pKa = 10.61DD50 pKa = 3.44EE51 pKa = 5.57SGDD54 pKa = 3.58VYY56 pKa = 11.27YY57 pKa = 11.15AGIDD61 pKa = 3.29EE62 pKa = 4.46EE63 pKa = 5.01EE64 pKa = 4.46YY65 pKa = 10.22VRR67 pKa = 11.84AMEE70 pKa = 4.58IYY72 pKa = 10.16EE73 pKa = 4.14EE74 pKa = 4.14LLIEE78 pKa = 4.29QAQQ81 pKa = 3.28
MM1 pKa = 7.22NRR3 pKa = 11.84QLFFDD8 pKa = 3.75EE9 pKa = 4.43MGNGISFIIKK19 pKa = 9.83ARR21 pKa = 11.84FRR23 pKa = 11.84VDD25 pKa = 3.14DD26 pKa = 4.0CDD28 pKa = 4.71YY29 pKa = 11.18IALLDD34 pKa = 4.56AEE36 pKa = 5.1HH37 pKa = 7.1IDD39 pKa = 3.59YY40 pKa = 8.25GTFILRR46 pKa = 11.84EE47 pKa = 4.14EE48 pKa = 4.36YY49 pKa = 10.61DD50 pKa = 3.44EE51 pKa = 5.57SGDD54 pKa = 3.58VYY56 pKa = 11.27YY57 pKa = 11.15AGIDD61 pKa = 3.29EE62 pKa = 4.46EE63 pKa = 5.01EE64 pKa = 4.46YY65 pKa = 10.22VRR67 pKa = 11.84AMEE70 pKa = 4.58IYY72 pKa = 10.16EE73 pKa = 4.14EE74 pKa = 4.14LLIEE78 pKa = 4.29QAQQ81 pKa = 3.28
Molecular weight: 9.62 kDa
Isoelectric point according different methods:
Protein with the highest isoelectric point:
>tr|A0A448V3G6|A0A448V3G6_9FIRM CRISPR-associated exonuclease Cas4 OS=Peptoniphilus ivorii OX=54006 GN=NCTC13079_01544 PE=3 SV=1
MM1 pKa = 6.37TTRR4 pKa = 11.84LRR6 pKa = 11.84RR7 pKa = 11.84GCNPNPISKK16 pKa = 9.82IIAVILLGTTVVRR29 pKa = 11.84SLPDD33 pKa = 3.13VCAWGVLSVISLFLFLNGQKK53 pKa = 8.76RR54 pKa = 11.84TAFRR58 pKa = 11.84QLLLYY63 pKa = 10.38AVLFGLPGLFALYY76 pKa = 9.71RR77 pKa = 11.84APFVVKK83 pKa = 9.92MLLSLLMVIRR93 pKa = 11.84LFFLPFAAGKK103 pKa = 9.56FLIRR107 pKa = 11.84TSDD110 pKa = 3.17VGSILSSMDD119 pKa = 3.28ALRR122 pKa = 11.84IPASVSIPIAVIFRR136 pKa = 11.84FFPAFRR142 pKa = 11.84EE143 pKa = 3.83EE144 pKa = 3.84RR145 pKa = 11.84RR146 pKa = 11.84NIRR149 pKa = 11.84TAMRR153 pKa = 11.84IRR155 pKa = 11.84GVLQGAPWRR164 pKa = 11.84YY165 pKa = 8.16PEE167 pKa = 4.28YY168 pKa = 10.71VAVPLLIASSEE179 pKa = 4.13IADD182 pKa = 5.05DD183 pKa = 3.26IAMAAEE189 pKa = 4.93AKK191 pKa = 10.51CIANPVAKK199 pKa = 9.35TRR201 pKa = 11.84YY202 pKa = 7.08TKK204 pKa = 10.73VAIGAADD211 pKa = 4.49LLYY214 pKa = 10.77LLPIVLFTVGGWLWW228 pKa = 3.27
MM1 pKa = 6.37TTRR4 pKa = 11.84LRR6 pKa = 11.84RR7 pKa = 11.84GCNPNPISKK16 pKa = 9.82IIAVILLGTTVVRR29 pKa = 11.84SLPDD33 pKa = 3.13VCAWGVLSVISLFLFLNGQKK53 pKa = 8.76RR54 pKa = 11.84TAFRR58 pKa = 11.84QLLLYY63 pKa = 10.38AVLFGLPGLFALYY76 pKa = 9.71RR77 pKa = 11.84APFVVKK83 pKa = 9.92MLLSLLMVIRR93 pKa = 11.84LFFLPFAAGKK103 pKa = 9.56FLIRR107 pKa = 11.84TSDD110 pKa = 3.17VGSILSSMDD119 pKa = 3.28ALRR122 pKa = 11.84IPASVSIPIAVIFRR136 pKa = 11.84FFPAFRR142 pKa = 11.84EE143 pKa = 3.83EE144 pKa = 3.84RR145 pKa = 11.84RR146 pKa = 11.84NIRR149 pKa = 11.84TAMRR153 pKa = 11.84IRR155 pKa = 11.84GVLQGAPWRR164 pKa = 11.84YY165 pKa = 8.16PEE167 pKa = 4.28YY168 pKa = 10.71VAVPLLIASSEE179 pKa = 4.13IADD182 pKa = 5.05DD183 pKa = 3.26IAMAAEE189 pKa = 4.93AKK191 pKa = 10.51CIANPVAKK199 pKa = 9.35TRR201 pKa = 11.84YY202 pKa = 7.08TKK204 pKa = 10.73VAIGAADD211 pKa = 4.49LLYY214 pKa = 10.77LLPIVLFTVGGWLWW228 pKa = 3.27
Molecular weight: 25.27 kDa
Isoelectric point according different methods:
Peptides (in silico digests for buttom-up proteomics)
Below you can find in silico digests of the whole proteome with Trypsin, Chymotrypsin, Trypsin+LysC, LysN, ArgC proteases suitable for different mass spec machines.| Try ESI |
 |
|---|
| ChTry ESI |
 |
|---|
| ArgC ESI |
 |
|---|
| LysN ESI |
 |
|---|
| TryLysC ESI |
 |
|---|
| Try MALDI |
 |
|---|
| ChTry MALDI |
 |
|---|
| ArgC MALDI |
 |
|---|
| LysN MALDI |
 |
|---|
| TryLysC MALDI |
 |
|---|
| Try LTQ |
 |
|---|
| ChTry LTQ |
 |
|---|
| ArgC LTQ |
 |
|---|
| LysN LTQ |
 |
|---|
| TryLysC LTQ |
 |
|---|
| Try MSlow |
 |
|---|
| ChTry MSlow |
 |
|---|
| ArgC MSlow |
 |
|---|
| LysN MSlow |
 |
|---|
| TryLysC MSlow |
 |
|---|
| Try MShigh |
 |
|---|
| ChTry MShigh |
 |
|---|
| ArgC MShigh |
 |
|---|
| LysN MShigh |
 |
|---|
| TryLysC MShigh |
 |
|---|
General Statistics
Number of major isoforms |
Number of additional isoforms |
Number of all proteins |
Number of amino acids |
Min. Seq. Length |
Max. Seq. Length |
Avg. Seq. Length |
Avg. Mol. Weight |
|---|---|---|---|---|---|---|---|
0 |
472416 |
29 |
2966 |
315.2 |
35.11 |
Amino acid frequency
Ala |
Cys |
Asp |
Glu |
Phe |
Gly |
His |
Ile |
Lys |
Leu |
|---|---|---|---|---|---|---|---|---|---|
9.103 ± 0.073 | 0.858 ± 0.021 |
6.202 ± 0.054 | 8.013 ± 0.064 |
4.136 ± 0.045 | 7.544 ± 0.052 |
1.829 ± 0.03 | 6.983 ± 0.05 |
6.047 ± 0.067 | 9.346 ± 0.079 |
Met |
Asn |
Gln |
Pro |
Arg |
Ser |
Thr |
Val |
Trp |
Tyr |
|---|---|---|---|---|---|---|---|---|---|
2.741 ± 0.032 | 3.422 ± 0.042 |
3.733 ± 0.039 | 2.547 ± 0.029 |
5.859 ± 0.069 | 5.267 ± 0.048 |
4.933 ± 0.054 | 7.1 ± 0.048 |
0.693 ± 0.02 | 3.645 ± 0.035 |
Most of the basic statistics you can see at this page can be downloaded from this CSV file
Proteome-pI is available under Creative Commons Attribution-NoDerivs license, for more details see here
| Reference: Kozlowski LP. Proteome-pI 2.0: Proteome Isoelectric Point Database Update. Nucleic Acids Res. 2021, doi: 10.1093/nar/gkab944 | Contact: Lukasz P. Kozlowski |
