Amycolatopsis alkalitolerans
Taxonomy: cellular organisms; Bacteria; Terrabacteria group; Actinobacteria; Actinomycetia; Pseudonocardiales; Pseudonocardiaceae; Amycolatopsis
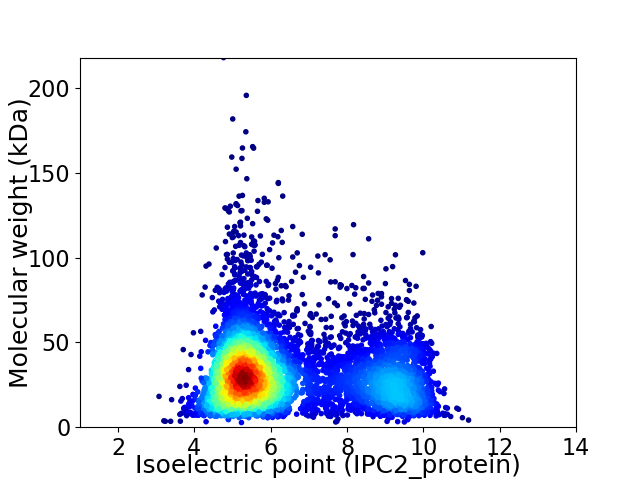
Average proteome isoelectric point is 6.44
Get precalculated fractions of proteins

Virtual 2D-PAGE plot for 6455 proteins (isoelectric point calculated using IPC2_protein)
Get csv file with sequences according to given criteria:
* You can choose from 21 different methods for calculating isoelectric point
Summary statistics related to proteome-wise predictions


Protein with the lowest isoelectric point:
>tr|A0A5C4LZD7|A0A5C4LZD7_9PSEU PadR family transcriptional regulator OS=Amycolatopsis alkalitolerans OX=2547244 GN=FG385_22210 PE=4 SV=1
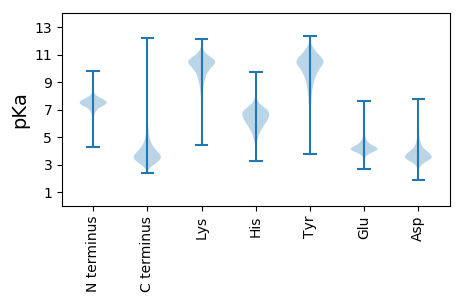
MM1 pKa = 7.16SQPIQTLHH9 pKa = 6.18EE10 pKa = 4.48FVFNLISNADD20 pKa = 3.57FGSAFLSDD28 pKa = 3.66PASALSAAGLGDD40 pKa = 3.21ITGADD45 pKa = 3.7VQEE48 pKa = 4.26VTPLVTDD55 pKa = 3.63SMPAPVADD63 pKa = 3.55AVEE66 pKa = 4.62SGLASLPTDD75 pKa = 3.82AFGTDD80 pKa = 4.18DD81 pKa = 3.74LHH83 pKa = 7.42CALTHH88 pKa = 6.48LEE90 pKa = 4.36TVASVAQSLPDD101 pKa = 3.7TALSTAGTLSSVTDD115 pKa = 3.43AMGVSGTFQGSADD128 pKa = 3.61GLATGMLASTPAGDD142 pKa = 3.57VTGALAATTGSLGAGMEE159 pKa = 4.56SPLGTYY165 pKa = 10.44GITTDD170 pKa = 4.05SLPLSVPSFGSVSDD184 pKa = 3.97LGGTLDD190 pKa = 3.99SAALTGGTPVTEE202 pKa = 4.29TATSYY207 pKa = 8.58VTSGTEE213 pKa = 3.65MATSGIANGSAMLGDD228 pKa = 5.21HH229 pKa = 7.08ISTAGTGLGGAVTAGGADD247 pKa = 3.87LANHH251 pKa = 5.14VTSAVSMAGDD261 pKa = 3.89LTSNLPTVSAPVHH274 pKa = 6.33LPADD278 pKa = 3.95LPVHH282 pKa = 6.46VVAQPPALPAADD294 pKa = 3.38AAVPQVTHH302 pKa = 5.45TVEE305 pKa = 4.3STVSHH310 pKa = 6.73ASVLPDD316 pKa = 3.6SLSHH320 pKa = 6.94GSLAGMAHH328 pKa = 6.02SAVPGVDD335 pKa = 3.41SLHH338 pKa = 6.5TDD340 pKa = 4.02LLHH343 pKa = 7.34GEE345 pKa = 4.57LPLGHH350 pKa = 7.14
MM1 pKa = 7.16SQPIQTLHH9 pKa = 6.18EE10 pKa = 4.48FVFNLISNADD20 pKa = 3.57FGSAFLSDD28 pKa = 3.66PASALSAAGLGDD40 pKa = 3.21ITGADD45 pKa = 3.7VQEE48 pKa = 4.26VTPLVTDD55 pKa = 3.63SMPAPVADD63 pKa = 3.55AVEE66 pKa = 4.62SGLASLPTDD75 pKa = 3.82AFGTDD80 pKa = 4.18DD81 pKa = 3.74LHH83 pKa = 7.42CALTHH88 pKa = 6.48LEE90 pKa = 4.36TVASVAQSLPDD101 pKa = 3.7TALSTAGTLSSVTDD115 pKa = 3.43AMGVSGTFQGSADD128 pKa = 3.61GLATGMLASTPAGDD142 pKa = 3.57VTGALAATTGSLGAGMEE159 pKa = 4.56SPLGTYY165 pKa = 10.44GITTDD170 pKa = 4.05SLPLSVPSFGSVSDD184 pKa = 3.97LGGTLDD190 pKa = 3.99SAALTGGTPVTEE202 pKa = 4.29TATSYY207 pKa = 8.58VTSGTEE213 pKa = 3.65MATSGIANGSAMLGDD228 pKa = 5.21HH229 pKa = 7.08ISTAGTGLGGAVTAGGADD247 pKa = 3.87LANHH251 pKa = 5.14VTSAVSMAGDD261 pKa = 3.89LTSNLPTVSAPVHH274 pKa = 6.33LPADD278 pKa = 3.95LPVHH282 pKa = 6.46VVAQPPALPAADD294 pKa = 3.38AAVPQVTHH302 pKa = 5.45TVEE305 pKa = 4.3STVSHH310 pKa = 6.73ASVLPDD316 pKa = 3.6SLSHH320 pKa = 6.94GSLAGMAHH328 pKa = 6.02SAVPGVDD335 pKa = 3.41SLHH338 pKa = 6.5TDD340 pKa = 4.02LLHH343 pKa = 7.34GEE345 pKa = 4.57LPLGHH350 pKa = 7.14
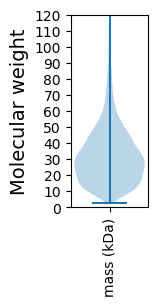
Molecular weight: 33.99 kDa
Isoelectric point according different methods:
Protein with the highest isoelectric point:
>tr|A0A5C4M5P3|A0A5C4M5P3_9PSEU BldC family transcriptional regulator OS=Amycolatopsis alkalitolerans OX=2547244 GN=FG385_04725 PE=4 SV=1
MM1 pKa = 7.4GSVIKK6 pKa = 10.38KK7 pKa = 8.42RR8 pKa = 11.84RR9 pKa = 11.84KK10 pKa = 9.06RR11 pKa = 11.84MSKK14 pKa = 9.76KK15 pKa = 9.54KK16 pKa = 9.72HH17 pKa = 5.63RR18 pKa = 11.84KK19 pKa = 7.68LLRR22 pKa = 11.84RR23 pKa = 11.84TRR25 pKa = 11.84MQRR28 pKa = 11.84RR29 pKa = 11.84KK30 pKa = 9.69QGKK33 pKa = 8.53
MM1 pKa = 7.4GSVIKK6 pKa = 10.38KK7 pKa = 8.42RR8 pKa = 11.84RR9 pKa = 11.84KK10 pKa = 9.06RR11 pKa = 11.84MSKK14 pKa = 9.76KK15 pKa = 9.54KK16 pKa = 9.72HH17 pKa = 5.63RR18 pKa = 11.84KK19 pKa = 7.68LLRR22 pKa = 11.84RR23 pKa = 11.84TRR25 pKa = 11.84MQRR28 pKa = 11.84RR29 pKa = 11.84KK30 pKa = 9.69QGKK33 pKa = 8.53
Molecular weight: 4.19 kDa
Isoelectric point according different methods:
Peptides (in silico digests for buttom-up proteomics)
Below you can find in silico digests of the whole proteome with Trypsin, Chymotrypsin, Trypsin+LysC, LysN, ArgC proteases suitable for different mass spec machines.| Try ESI |
 |
|---|
| ChTry ESI |
 |
|---|
| ArgC ESI |
 |
|---|
| LysN ESI |
 |
|---|
| TryLysC ESI |
 |
|---|
| Try MALDI |
 |
|---|
| ChTry MALDI |
 |
|---|
| ArgC MALDI |
 |
|---|
| LysN MALDI |
 |
|---|
| TryLysC MALDI |
 |
|---|
| Try LTQ |
 |
|---|
| ChTry LTQ |
 |
|---|
| ArgC LTQ |
 |
|---|
| LysN LTQ |
 |
|---|
| TryLysC LTQ |
 |
|---|
| Try MSlow |
 |
|---|
| ChTry MSlow |
 |
|---|
| ArgC MSlow |
 |
|---|
| LysN MSlow |
 |
|---|
| TryLysC MSlow |
 |
|---|
| Try MShigh |
 |
|---|
| ChTry MShigh |
 |
|---|
| ArgC MShigh |
 |
|---|
| LysN MShigh |
 |
|---|
| TryLysC MShigh |
 |
|---|
General Statistics
Number of major isoforms |
Number of additional isoforms |
Number of all proteins |
Number of amino acids |
Min. Seq. Length |
Max. Seq. Length |
Avg. Seq. Length |
Avg. Mol. Weight |
|---|---|---|---|---|---|---|---|
0 |
2018279 |
27 |
2075 |
312.7 |
33.56 |
Amino acid frequency
Ala |
Cys |
Asp |
Glu |
Phe |
Gly |
His |
Ile |
Lys |
Leu |
|---|---|---|---|---|---|---|---|---|---|
13.215 ± 0.045 | 0.793 ± 0.01 |
5.663 ± 0.024 | 5.775 ± 0.028 |
2.97 ± 0.019 | 9.339 ± 0.03 |
2.237 ± 0.014 | 3.696 ± 0.019 |
2.13 ± 0.02 | 10.581 ± 0.04 |
Met |
Asn |
Gln |
Pro |
Arg |
Ser |
Thr |
Val |
Trp |
Tyr |
|---|---|---|---|---|---|---|---|---|---|
1.778 ± 0.012 | 1.912 ± 0.018 |
5.798 ± 0.025 | 2.799 ± 0.016 |
8.004 ± 0.035 | 5.083 ± 0.021 |
5.814 ± 0.024 | 8.873 ± 0.025 |
1.478 ± 0.013 | 2.064 ± 0.017 |
Most of the basic statistics you can see at this page can be downloaded from this CSV file
Proteome-pI is available under Creative Commons Attribution-NoDerivs license, for more details see here
| Reference: Kozlowski LP. Proteome-pI 2.0: Proteome Isoelectric Point Database Update. Nucleic Acids Res. 2021, doi: 10.1093/nar/gkab944 | Contact: Lukasz P. Kozlowski |
