Parcubacteria bacterium RAAC4_OD1_1
Taxonomy: cellular organisms; Bacteria; Bacteria incertae sedis; Bacteria candidate phyla; Patescibacteria group; Parcubacteria group; Candidatus Parcubacteria; unclassified Parcubacteria
Average proteome isoelectric point is 6.96
Get precalculated fractions of proteins

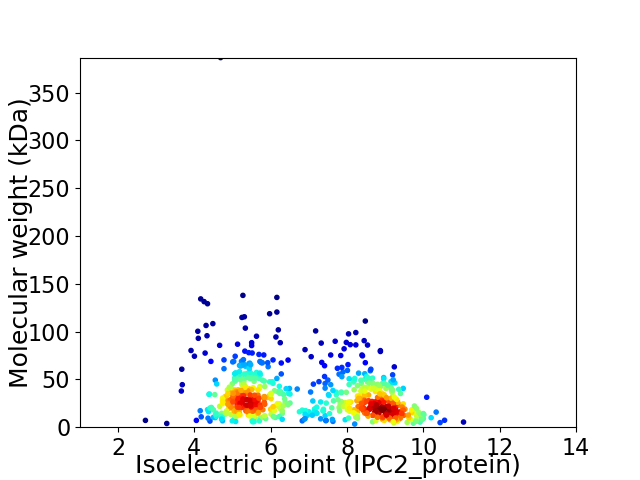
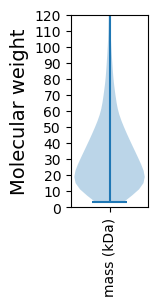
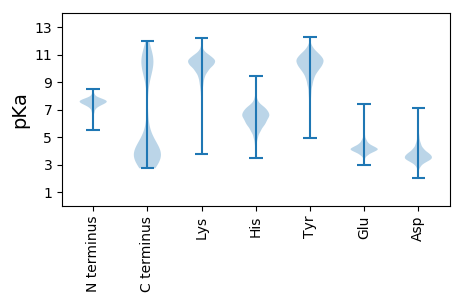
Virtual 2D-PAGE plot for 686 proteins (isoelectric point calculated using IPC2_protein)
Get csv file with sequences according to given criteria:
* You can choose from 21 different methods for calculating isoelectric point
Summary statistics related to proteome-wise predictions


Protein with the lowest isoelectric point:
>tr|V7PVL6|V7PVL6_9BACT 50S ribosomal protein L32 OS=Parcubacteria bacterium RAAC4_OD1_1 OX=1394712 GN=rpmF PE=3 SV=1
MM1 pKa = 7.33IKK3 pKa = 10.26KK4 pKa = 9.57IVSLVVMTSFVLTMTGVFPLTLMAASISSSKK35 pKa = 10.01ATFGRR40 pKa = 11.84LKK42 pKa = 10.74ASTPSDD48 pKa = 3.41SVIIQFVSPTGIQTGGADD66 pKa = 3.94TISLTFSSDD75 pKa = 3.24FTVAPEE81 pKa = 3.69AVANFDD87 pKa = 3.61VGLGNSGVCSSATYY101 pKa = 9.22TDD103 pKa = 4.4EE104 pKa = 5.36IISLTASATDD114 pKa = 3.11WGVDD118 pKa = 3.18VTGNVITFSPEE129 pKa = 3.39TDD131 pKa = 3.48DD132 pKa = 4.72VLTAGYY138 pKa = 9.57CIRR141 pKa = 11.84IEE143 pKa = 4.17MGTAATTGGAGSASTITNGLADD165 pKa = 5.43DD166 pKa = 5.78DD167 pKa = 4.26DD168 pKa = 5.14TITIAGGFGDD178 pKa = 4.25TGVMTVDD185 pKa = 4.63IVDD188 pKa = 4.43DD189 pKa = 4.21DD190 pKa = 4.23QVTVTATVNQTMTFDD205 pKa = 4.76LDD207 pKa = 3.72TSVTDD212 pKa = 3.89SEE214 pKa = 4.23TDD216 pKa = 3.06APYY219 pKa = 9.75TVPLGVLSSSSVKK232 pKa = 10.52VSGSTDD238 pKa = 3.26SVNMIIAEE246 pKa = 4.29GNTNASGGMNVTVKK260 pKa = 10.44NANGANGLVSTSTPADD276 pKa = 4.41RR277 pKa = 11.84IEE279 pKa = 4.37SATGTMIAGTEE290 pKa = 3.95NYY292 pKa = 9.05GLCVASASLAGFTRR306 pKa = 11.84ATAYY310 pKa = 7.7NTNCALNSEE319 pKa = 4.52TNAIIGLTTTTADD332 pKa = 4.44LLTSSAPISSAHH344 pKa = 6.52AEE346 pKa = 4.07IVVNAAIAGATPAHH360 pKa = 6.48TDD362 pKa = 3.33YY363 pKa = 11.4TDD365 pKa = 3.11TLTFIATASYY375 pKa = 11.15
MM1 pKa = 7.33IKK3 pKa = 10.26KK4 pKa = 9.57IVSLVVMTSFVLTMTGVFPLTLMAASISSSKK35 pKa = 10.01ATFGRR40 pKa = 11.84LKK42 pKa = 10.74ASTPSDD48 pKa = 3.41SVIIQFVSPTGIQTGGADD66 pKa = 3.94TISLTFSSDD75 pKa = 3.24FTVAPEE81 pKa = 3.69AVANFDD87 pKa = 3.61VGLGNSGVCSSATYY101 pKa = 9.22TDD103 pKa = 4.4EE104 pKa = 5.36IISLTASATDD114 pKa = 3.11WGVDD118 pKa = 3.18VTGNVITFSPEE129 pKa = 3.39TDD131 pKa = 3.48DD132 pKa = 4.72VLTAGYY138 pKa = 9.57CIRR141 pKa = 11.84IEE143 pKa = 4.17MGTAATTGGAGSASTITNGLADD165 pKa = 5.43DD166 pKa = 5.78DD167 pKa = 4.26DD168 pKa = 5.14TITIAGGFGDD178 pKa = 4.25TGVMTVDD185 pKa = 4.63IVDD188 pKa = 4.43DD189 pKa = 4.21DD190 pKa = 4.23QVTVTATVNQTMTFDD205 pKa = 4.76LDD207 pKa = 3.72TSVTDD212 pKa = 3.89SEE214 pKa = 4.23TDD216 pKa = 3.06APYY219 pKa = 9.75TVPLGVLSSSSVKK232 pKa = 10.52VSGSTDD238 pKa = 3.26SVNMIIAEE246 pKa = 4.29GNTNASGGMNVTVKK260 pKa = 10.44NANGANGLVSTSTPADD276 pKa = 4.41RR277 pKa = 11.84IEE279 pKa = 4.37SATGTMIAGTEE290 pKa = 3.95NYY292 pKa = 9.05GLCVASASLAGFTRR306 pKa = 11.84ATAYY310 pKa = 7.7NTNCALNSEE319 pKa = 4.52TNAIIGLTTTTADD332 pKa = 4.44LLTSSAPISSAHH344 pKa = 6.52AEE346 pKa = 4.07IVVNAAIAGATPAHH360 pKa = 6.48TDD362 pKa = 3.33YY363 pKa = 11.4TDD365 pKa = 3.11TLTFIATASYY375 pKa = 11.15
Molecular weight: 37.84 kDa
Isoelectric point according different methods:
Protein with the highest isoelectric point:
>tr|V7PZN2|V7PZN2_9BACT Uncharacterized protein OS=Parcubacteria bacterium RAAC4_OD1_1 OX=1394712 GN=O210_OD1C00001G0610 PE=4 SV=1
MM1 pKa = 7.07SQTYY5 pKa = 9.4QPNKK9 pKa = 9.02RR10 pKa = 11.84KK11 pKa = 9.56RR12 pKa = 11.84AKK14 pKa = 8.9THH16 pKa = 5.79GFLSRR21 pKa = 11.84TKK23 pKa = 9.21TPGGRR28 pKa = 11.84KK29 pKa = 6.09VTQARR34 pKa = 11.84RR35 pKa = 11.84RR36 pKa = 11.84KK37 pKa = 8.76GRR39 pKa = 11.84VRR41 pKa = 11.84VSIKK45 pKa = 10.36KK46 pKa = 10.0
MM1 pKa = 7.07SQTYY5 pKa = 9.4QPNKK9 pKa = 9.02RR10 pKa = 11.84KK11 pKa = 9.56RR12 pKa = 11.84AKK14 pKa = 8.9THH16 pKa = 5.79GFLSRR21 pKa = 11.84TKK23 pKa = 9.21TPGGRR28 pKa = 11.84KK29 pKa = 6.09VTQARR34 pKa = 11.84RR35 pKa = 11.84RR36 pKa = 11.84KK37 pKa = 8.76GRR39 pKa = 11.84VRR41 pKa = 11.84VSIKK45 pKa = 10.36KK46 pKa = 10.0
Molecular weight: 5.38 kDa
Isoelectric point according different methods:
Peptides (in silico digests for buttom-up proteomics)
Below you can find in silico digests of the whole proteome with Trypsin, Chymotrypsin, Trypsin+LysC, LysN, ArgC proteases suitable for different mass spec machines.| Try ESI |
 |
|---|
| ChTry ESI |
 |
|---|
| ArgC ESI |
 |
|---|
| LysN ESI |
 |
|---|
| TryLysC ESI |
 |
|---|
| Try MALDI |
 |
|---|
| ChTry MALDI |
 |
|---|
| ArgC MALDI |
 |
|---|
| LysN MALDI |
 |
|---|
| TryLysC MALDI |
 |
|---|
| Try LTQ |
 |
|---|
| ChTry LTQ |
 |
|---|
| ArgC LTQ |
 |
|---|
| LysN LTQ |
 |
|---|
| TryLysC LTQ |
 |
|---|
| Try MSlow |
 |
|---|
| ChTry MSlow |
 |
|---|
| ArgC MSlow |
 |
|---|
| LysN MSlow |
 |
|---|
| TryLysC MSlow |
 |
|---|
| Try MShigh |
 |
|---|
| ChTry MShigh |
 |
|---|
| ArgC MShigh |
 |
|---|
| LysN MShigh |
 |
|---|
| TryLysC MShigh |
 |
|---|
General Statistics
Number of major isoforms |
Number of additional isoforms |
Number of all proteins |
Number of amino acids |
Min. Seq. Length |
Max. Seq. Length |
Avg. Seq. Length |
Avg. Mol. Weight |
|---|---|---|---|---|---|---|---|
0 |
206949 |
29 |
3710 |
301.7 |
34.08 |
Amino acid frequency
Ala |
Cys |
Asp |
Glu |
Phe |
Gly |
His |
Ile |
Lys |
Leu |
|---|---|---|---|---|---|---|---|---|---|
4.944 ± 0.1 | 0.773 ± 0.043 |
5.515 ± 0.064 | 7.41 ± 0.144 |
4.832 ± 0.082 | 6.736 ± 0.13 |
1.439 ± 0.039 | 9.88 ± 0.133 |
9.543 ± 0.192 | 8.646 ± 0.105 |
Met |
Asn |
Gln |
Pro |
Arg |
Ser |
Thr |
Val |
Trp |
Tyr |
|---|---|---|---|---|---|---|---|---|---|
2.221 ± 0.042 | 6.224 ± 0.095 |
3.221 ± 0.048 | 2.217 ± 0.042 |
3.436 ± 0.069 | 6.995 ± 0.108 |
5.272 ± 0.204 | 6.015 ± 0.07 |
0.899 ± 0.032 | 3.766 ± 0.067 |
Most of the basic statistics you can see at this page can be downloaded from this CSV file
Proteome-pI is available under Creative Commons Attribution-NoDerivs license, for more details see here
| Reference: Kozlowski LP. Proteome-pI 2.0: Proteome Isoelectric Point Database Update. Nucleic Acids Res. 2021, doi: 10.1093/nar/gkab944 | Contact: Lukasz P. Kozlowski |
